17

I have multiple lines features (also have them in multipoints...) representing similar path (mountain trails, in this case) with various GPS precision, resulting in many lines close to each other, but not perfectly overlapping.

For the purpose of this project, I'm looking for a way to calculate a "mean" line from all of them and generate a resulting line of the most probable position of the trail.

How would you proceed, using QGIS or any other tool (I thought of OGR...)?

enter image description here

4
  • Take a look at Average tracks on the OpenStreetMap wiki, which describes a method using R.
    – Jake
    Commented Nov 27, 2014 at 21:59
  • 2
    This sounds a similar to "conflation" and on this site there's been a few threads about it: gis.stackexchange.com/search?q=conflation do any of the questions and answers there get you closer?
    – SaultDon
    Commented Nov 28, 2014 at 2:37
  • I'll take a look at "conflation" today, but so far, the "Average tracks" proposed earlier seems to do the trick. I'm simply looking a bit more to see if it can be done directly through QGIS, but both your answers are great, thanks!
    – Horizen
    Commented Nov 28, 2014 at 19:22
  • You might look at this thread and its links: gis.stackexchange.com/questions/70623/…
    – John
    Commented Feb 12, 2018 at 14:15

2 Answers 2

17

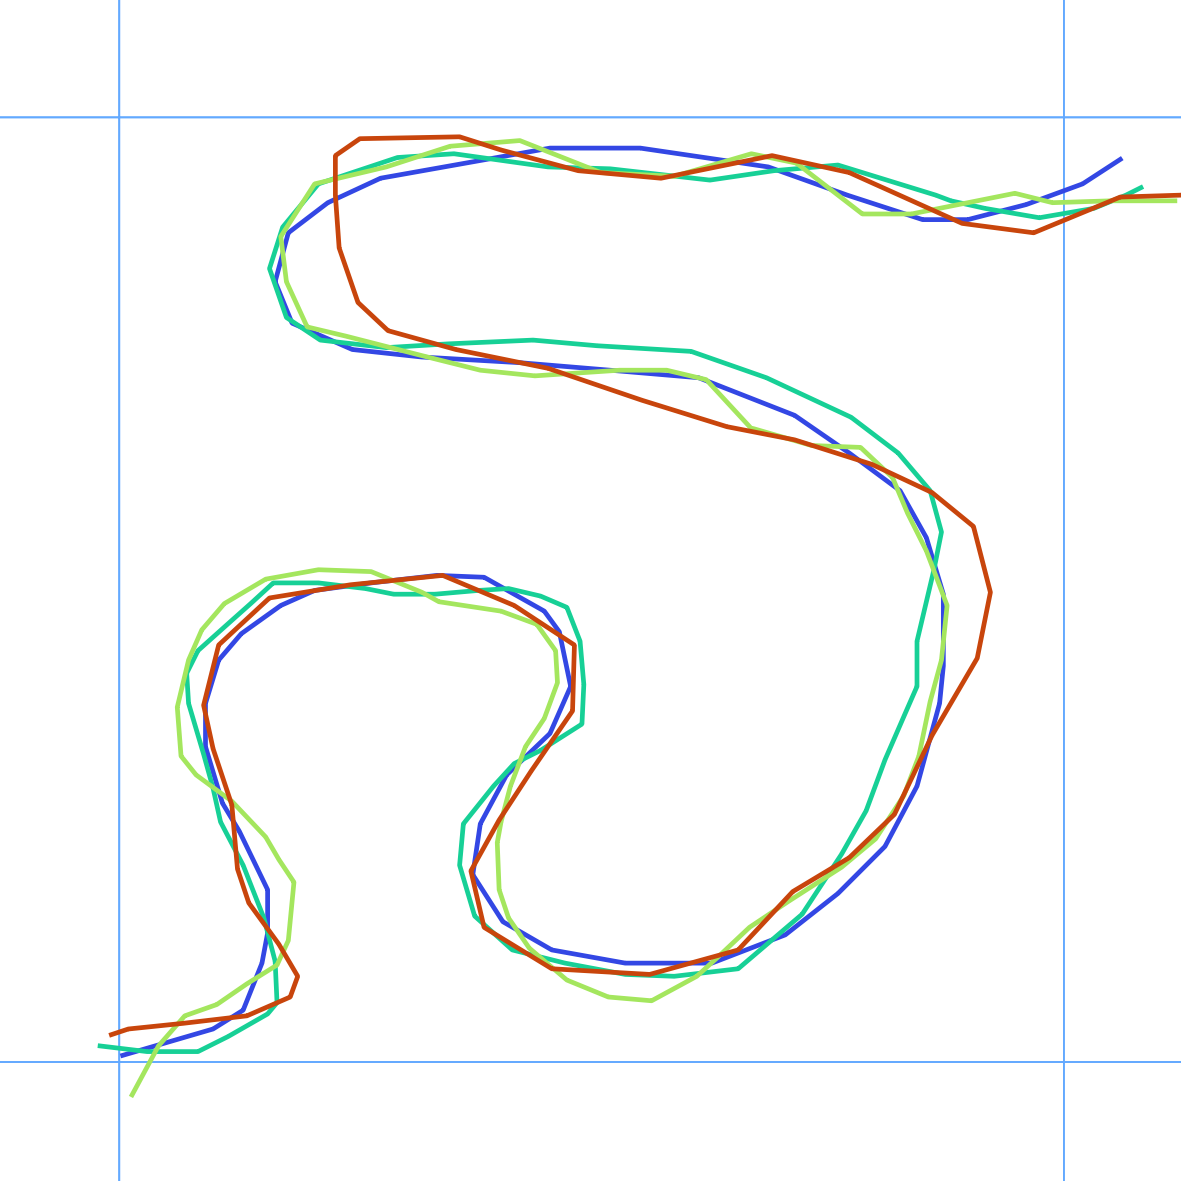
Test Data:

  • QGIS 2.18.16, GRASS GIS 7
  • 4 GPS Tracks
  • within a grid of 1x1km

I.)

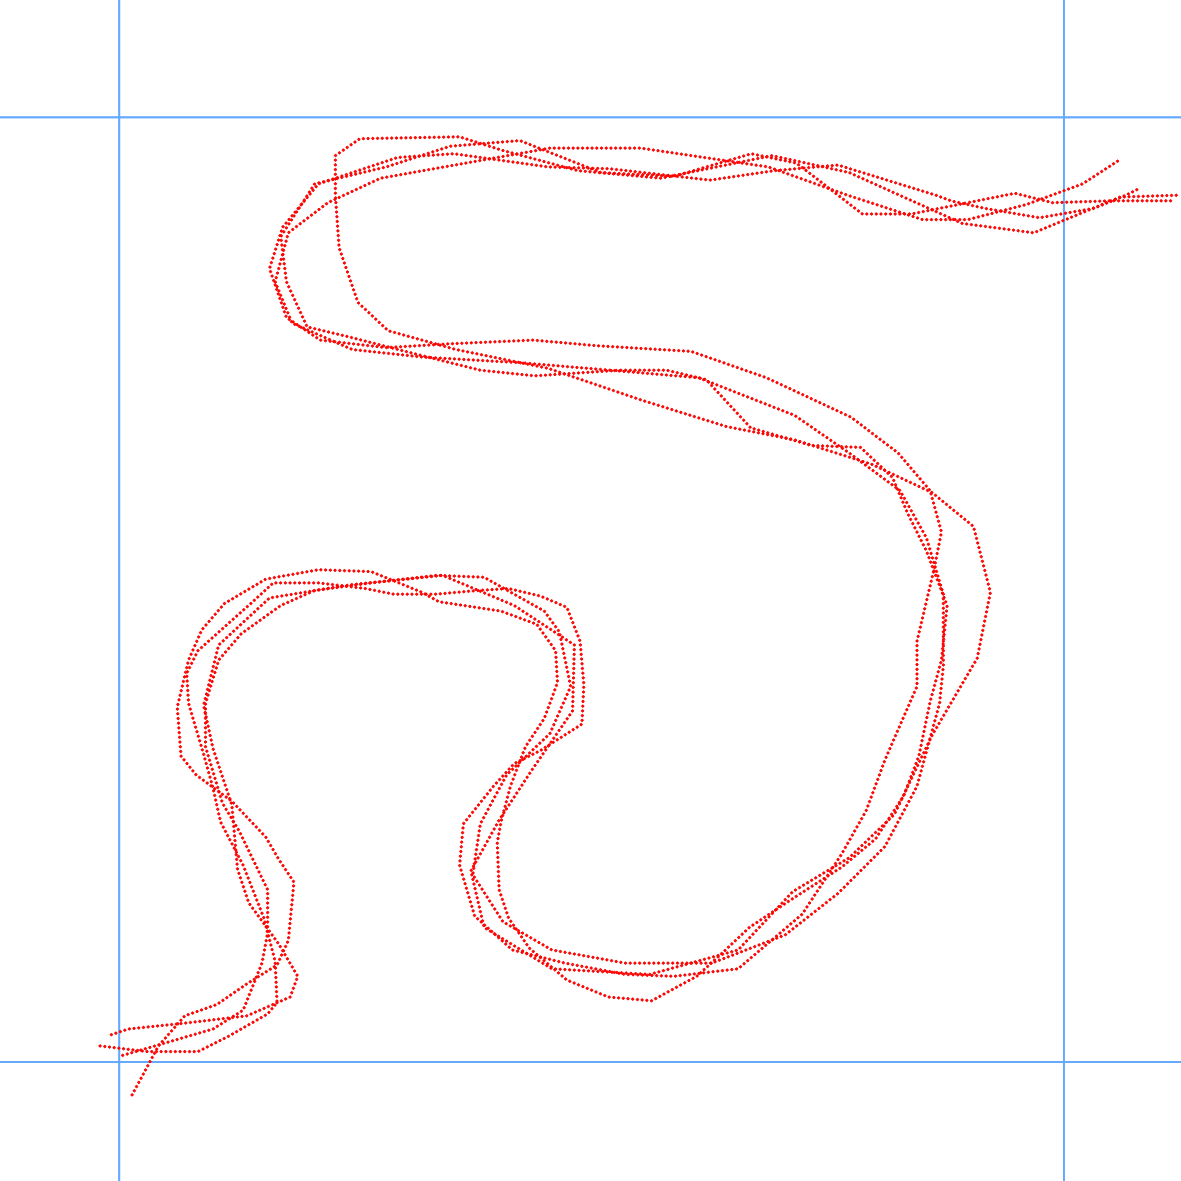
Create points along your GPS Tracks with the QGIS Plugin Locate Points Along Lines (https://plugins.qgis.org/plugins/LocatePoints/). I've used an interval of 5m in my exmaple.

enter image description here

enter image description here

II.)

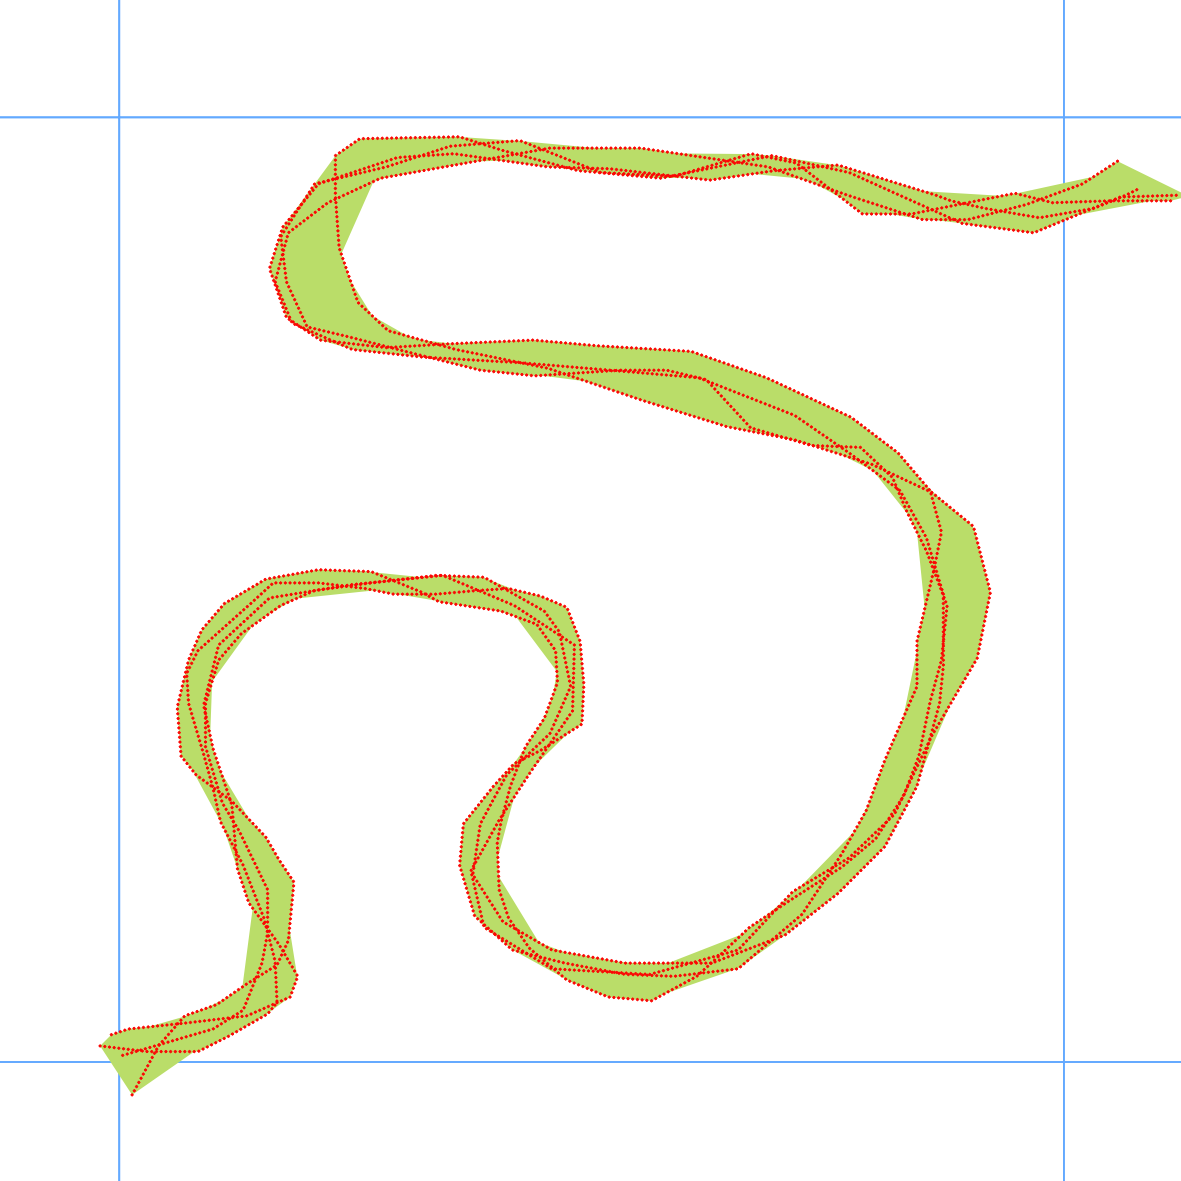
Create a Concave Hull with Processing > Toolbox > QGIS geoalgorithms >Vector geometry tools > Concave hull. I used a threshold of 0.1 in my example. If the threshold is to low, there could be holes within the output polygon.

enter image description here

III.)

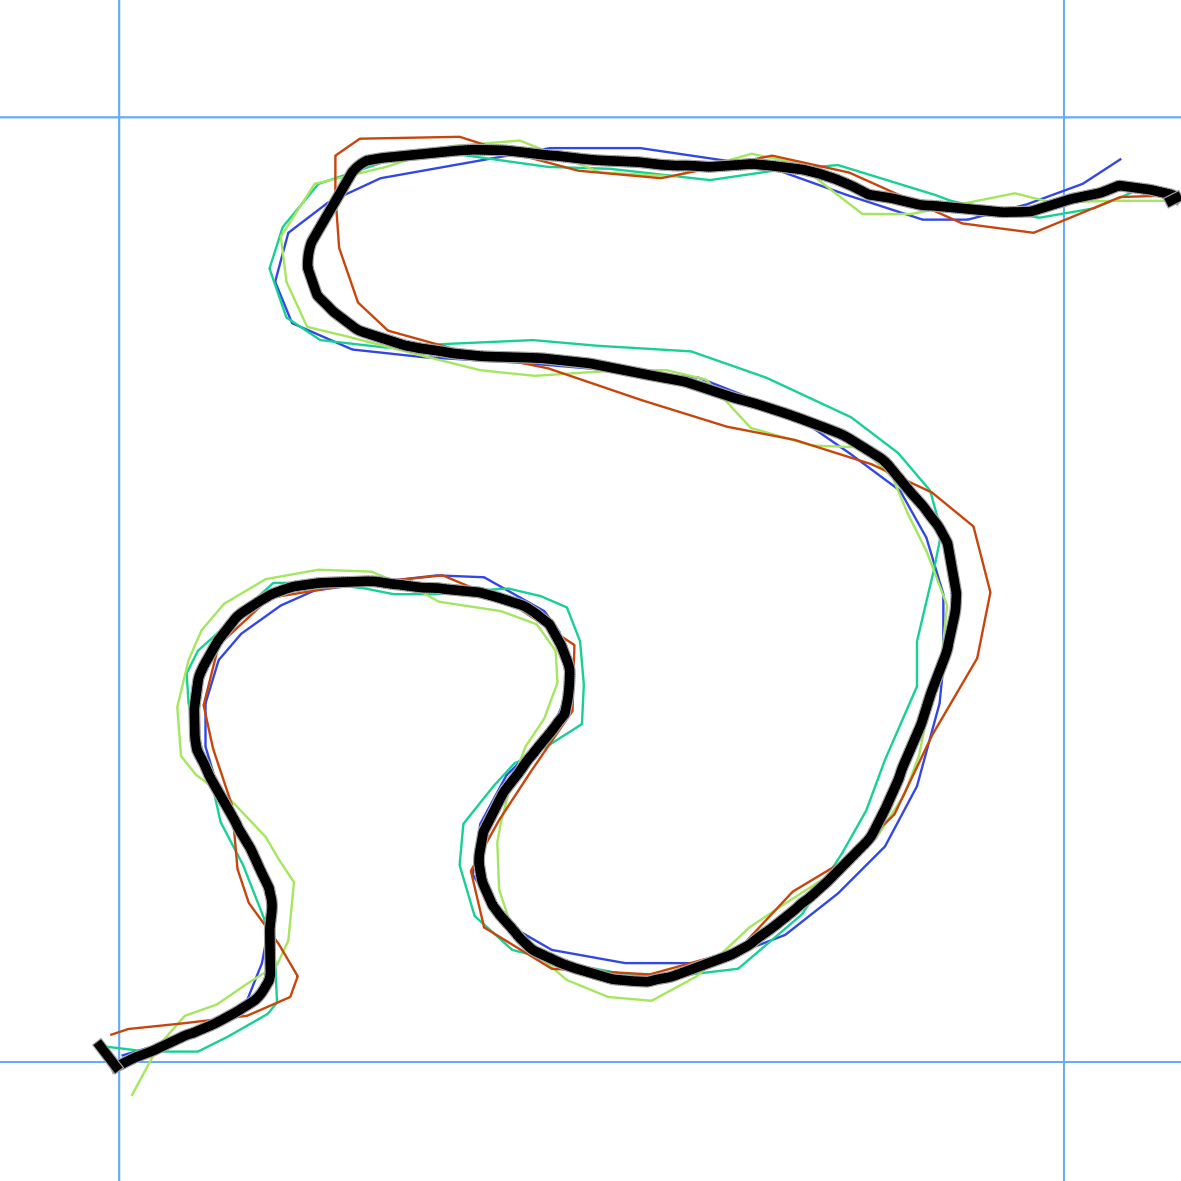
Now, you can calculate the "mean" line with the help of the skeleton algorithm. Search for skeleton in the Processing Toolbox. Use v.voronoi.skeleton tool from the GRASS GIS 7 commands.

enter image description here

11

The heat map approach:

The approach is more time consuming, due to the calculating time of the processing steps. It could be seen as an idea maybe to get closer to a more general solution.

Test Data:

  • QGIS 2.18.16, GRASS GIS 7
  • 4 GPS Tracks
  • within a grid of 1x1km

I.)

Create points along your GPS Tracks with the QGIS Plugin Locate Points Along Lines (https://plugins.qgis.org/plugins/LocatePoints/). For the heat map approach I've used an interval of 2m.

II.)

Create a heat map with the QGIS heat map plugin. I've used a radius of 40m. I increase the radius until there are no holes in the output raster. You have to try this with different radius values.
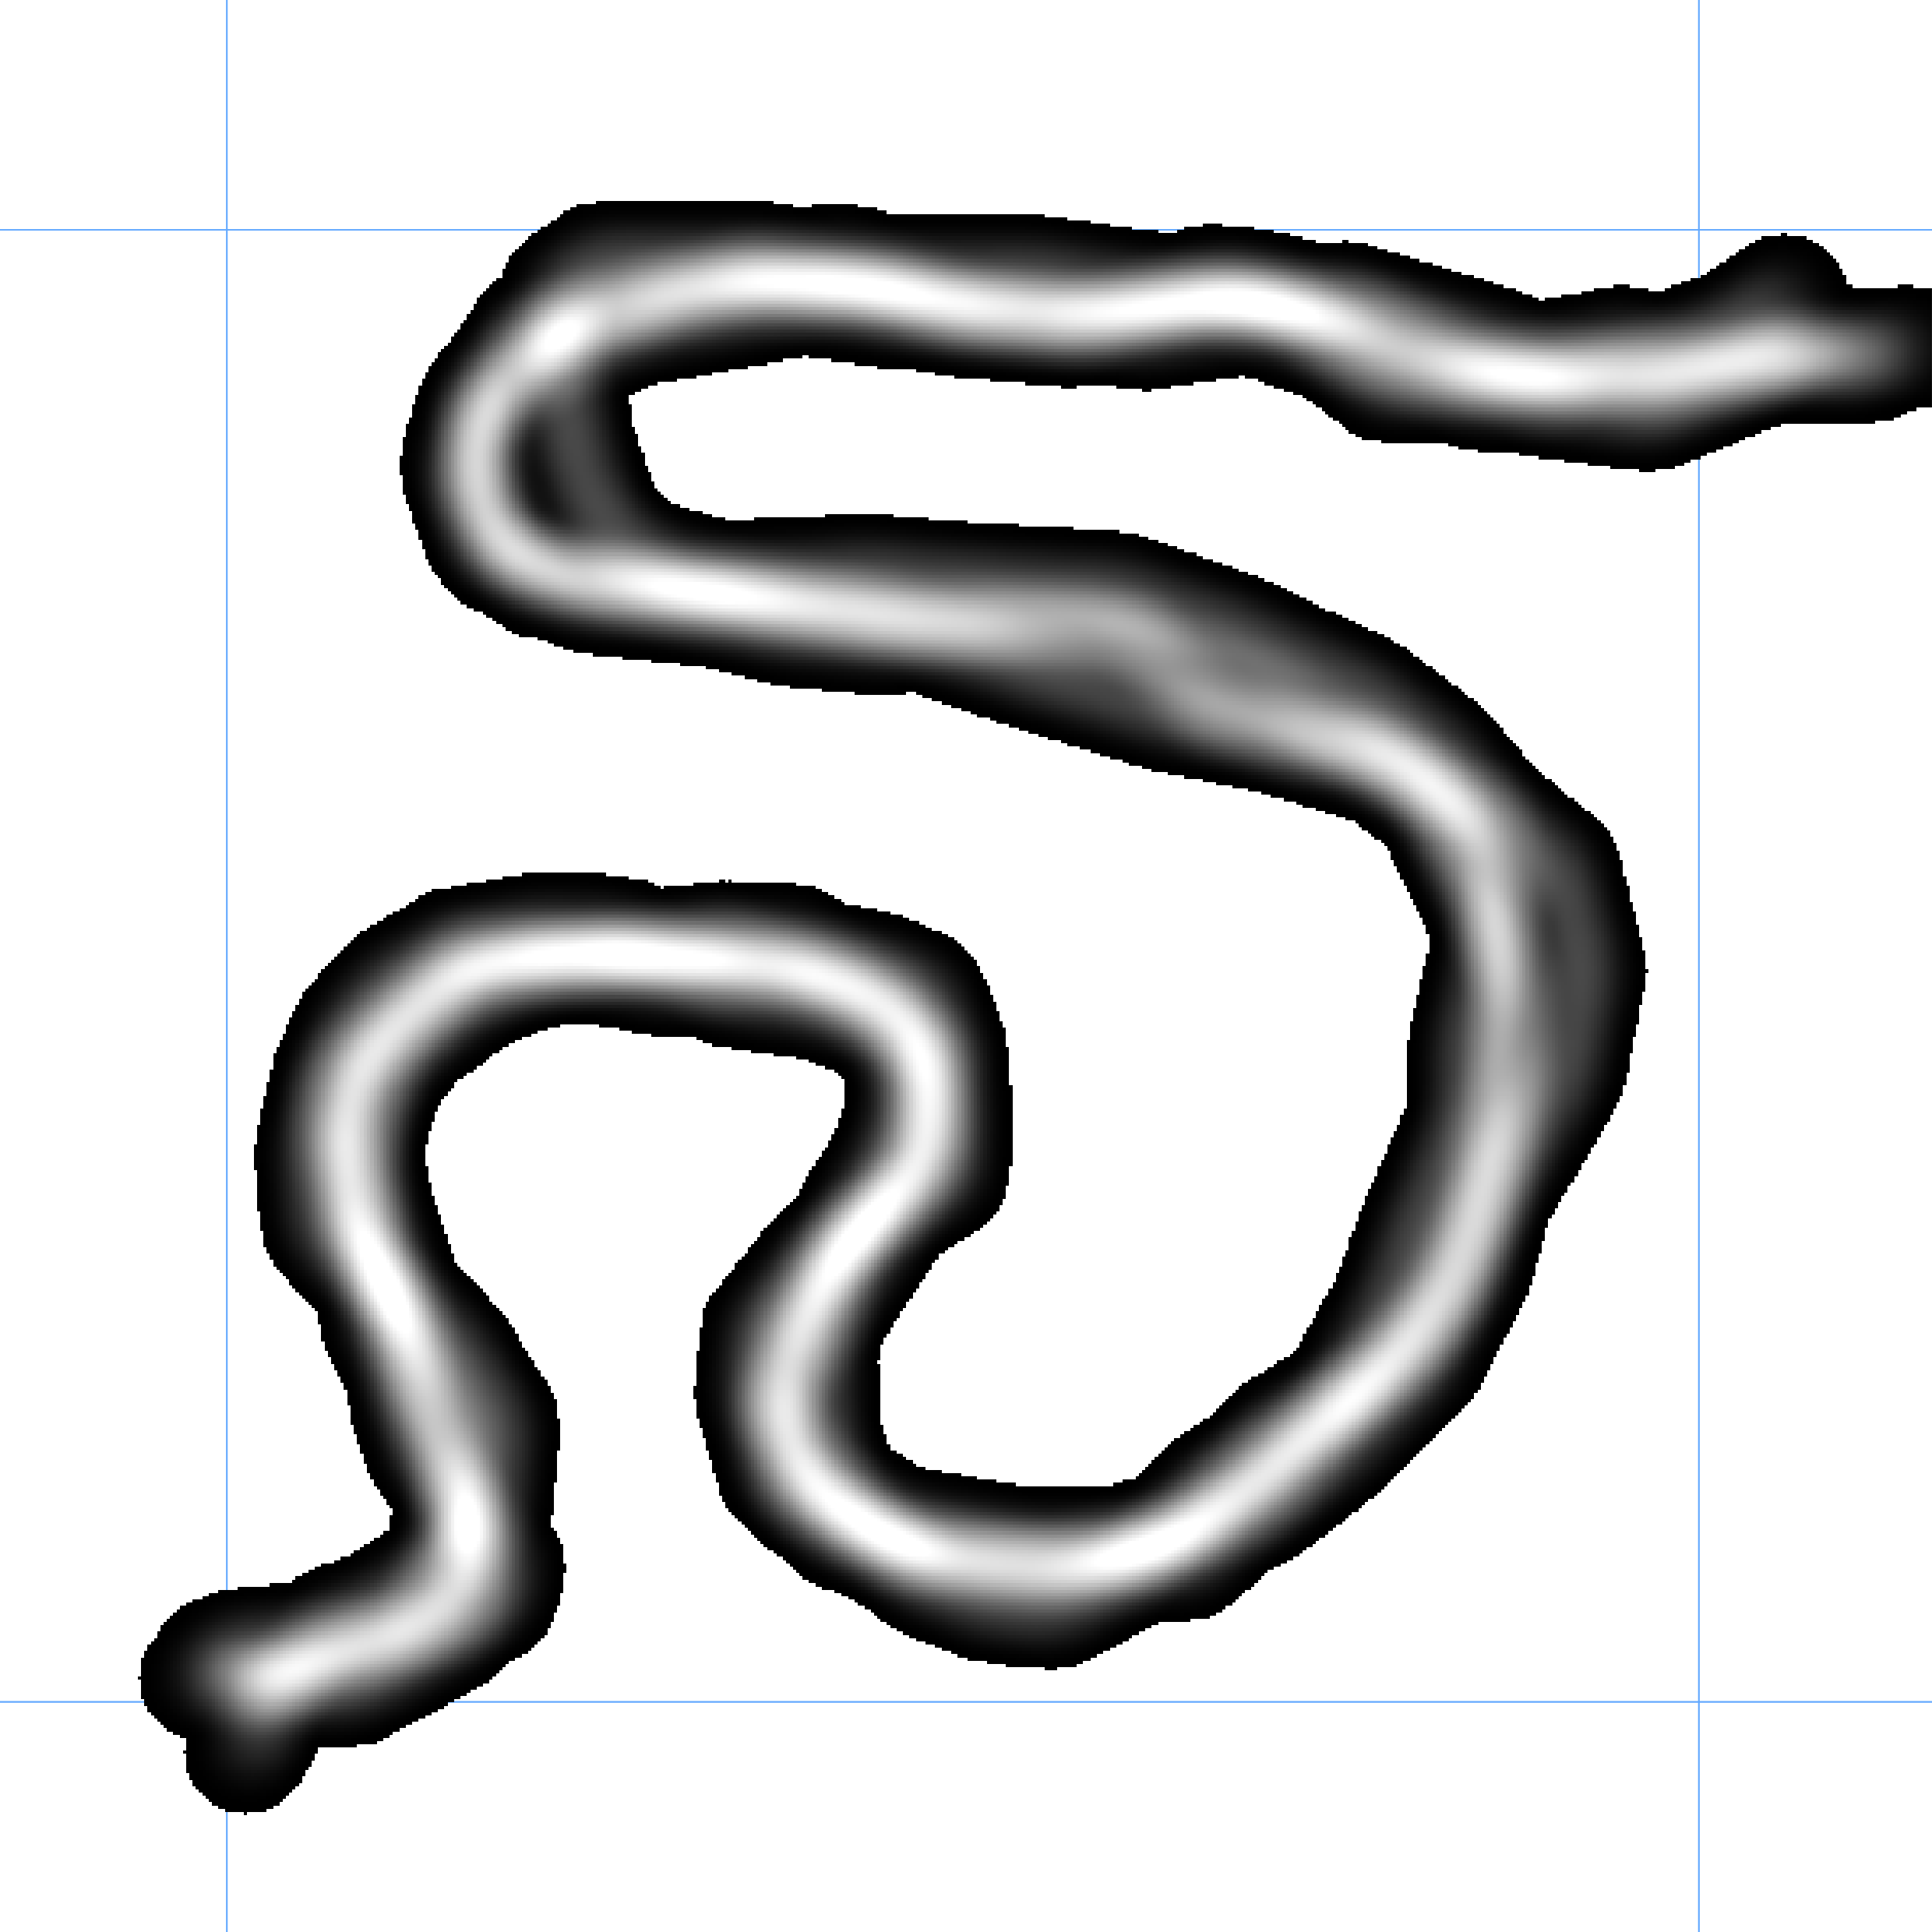
enter image description here

III.)

EDITED There is no need to hold the exact heat map raster value.

Now I want to thin out the raster to the "white" areas, where the most points are concentrated. Therefor I recalculate the output raster. The min/max values of the output raster is 0 and 89.7935. I only use values above 44. Therefor I used a "rule of thumb". Round down the max value and divide it by two. Round down this value another time. 89/2 = 44,5 --> 44. I've used the OSGeo4W Shell: gdal_calc -A heatmap.tif --calc="A>=44" --NoDataValue=0 --outfile=heatmap_44_NoData.tif.
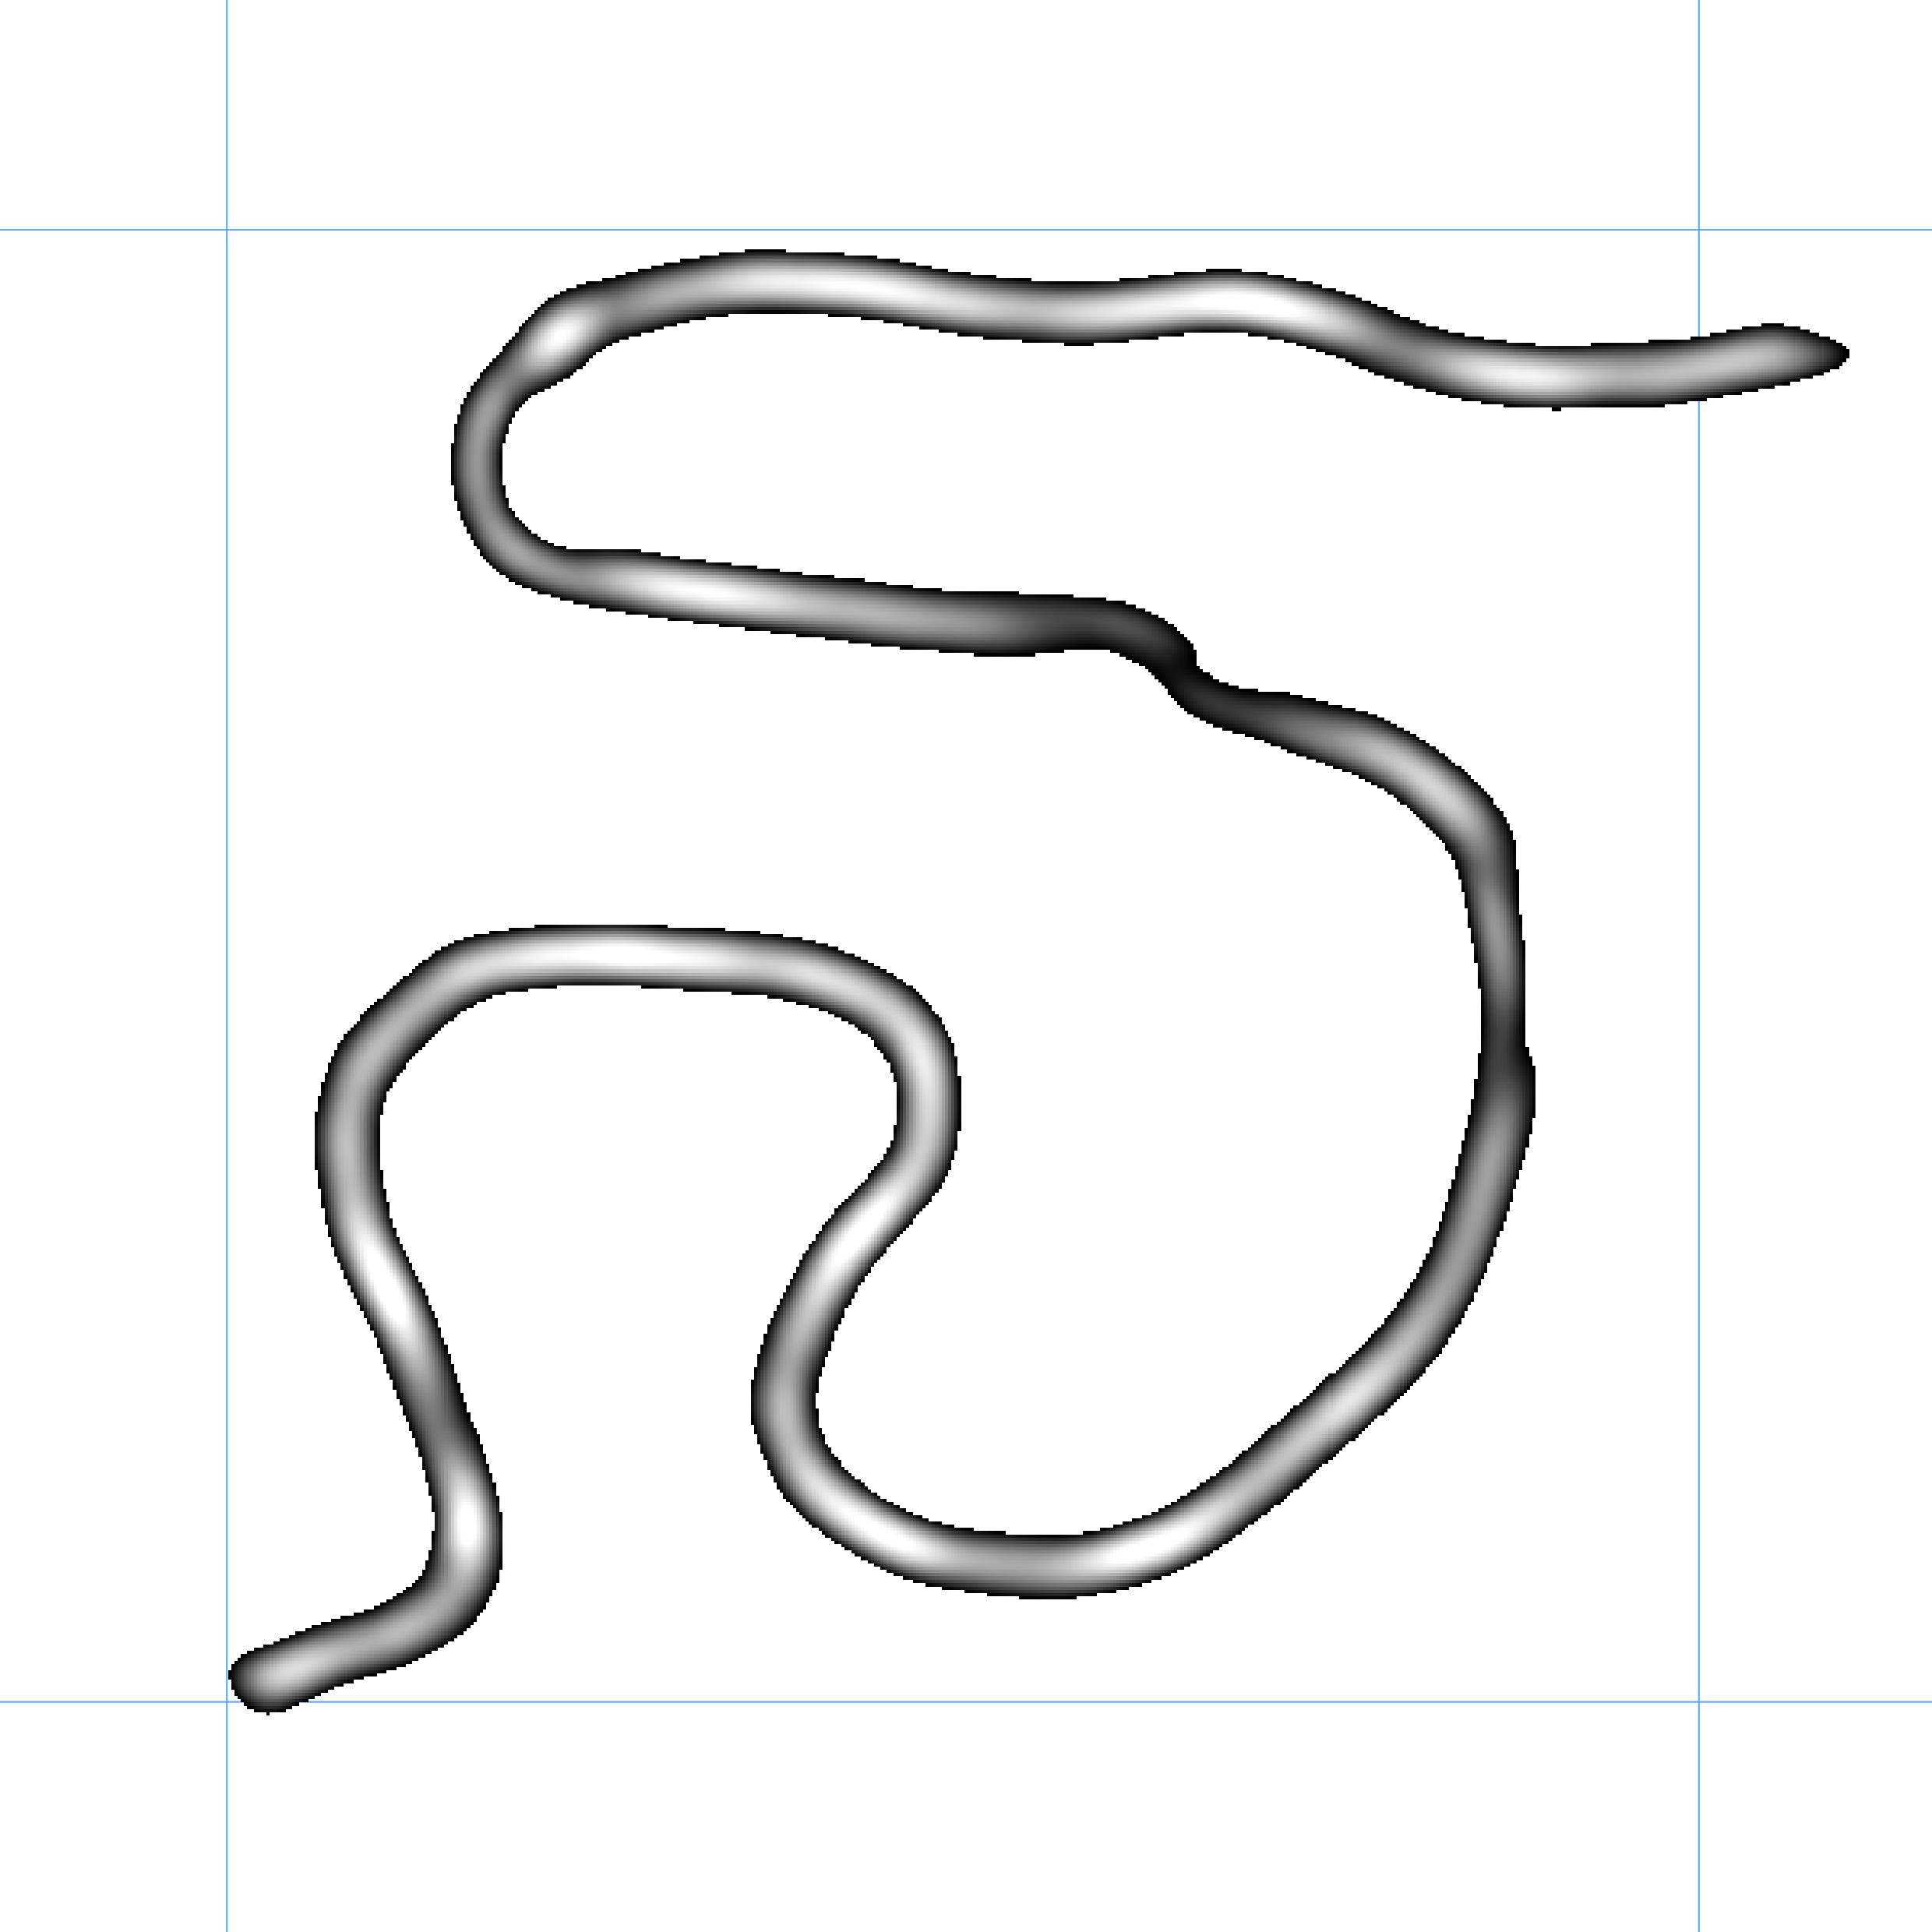
enter image description here

IV.)

EDITED

a) Polygonize the recalculated heat map with Raster > Conversion > Polygonize ...

b) Simplify the polygon Vector > Geometry Tools > Simplify geometries. I've used a tolerance of 2. A simpler polygon reduces the processing time for the skeletons.

c) Calculate skeletons: search for skeleton in the Processing Toolbox. Use v.voronoi.skeleton tool from the GRASS GIS 7 commands.
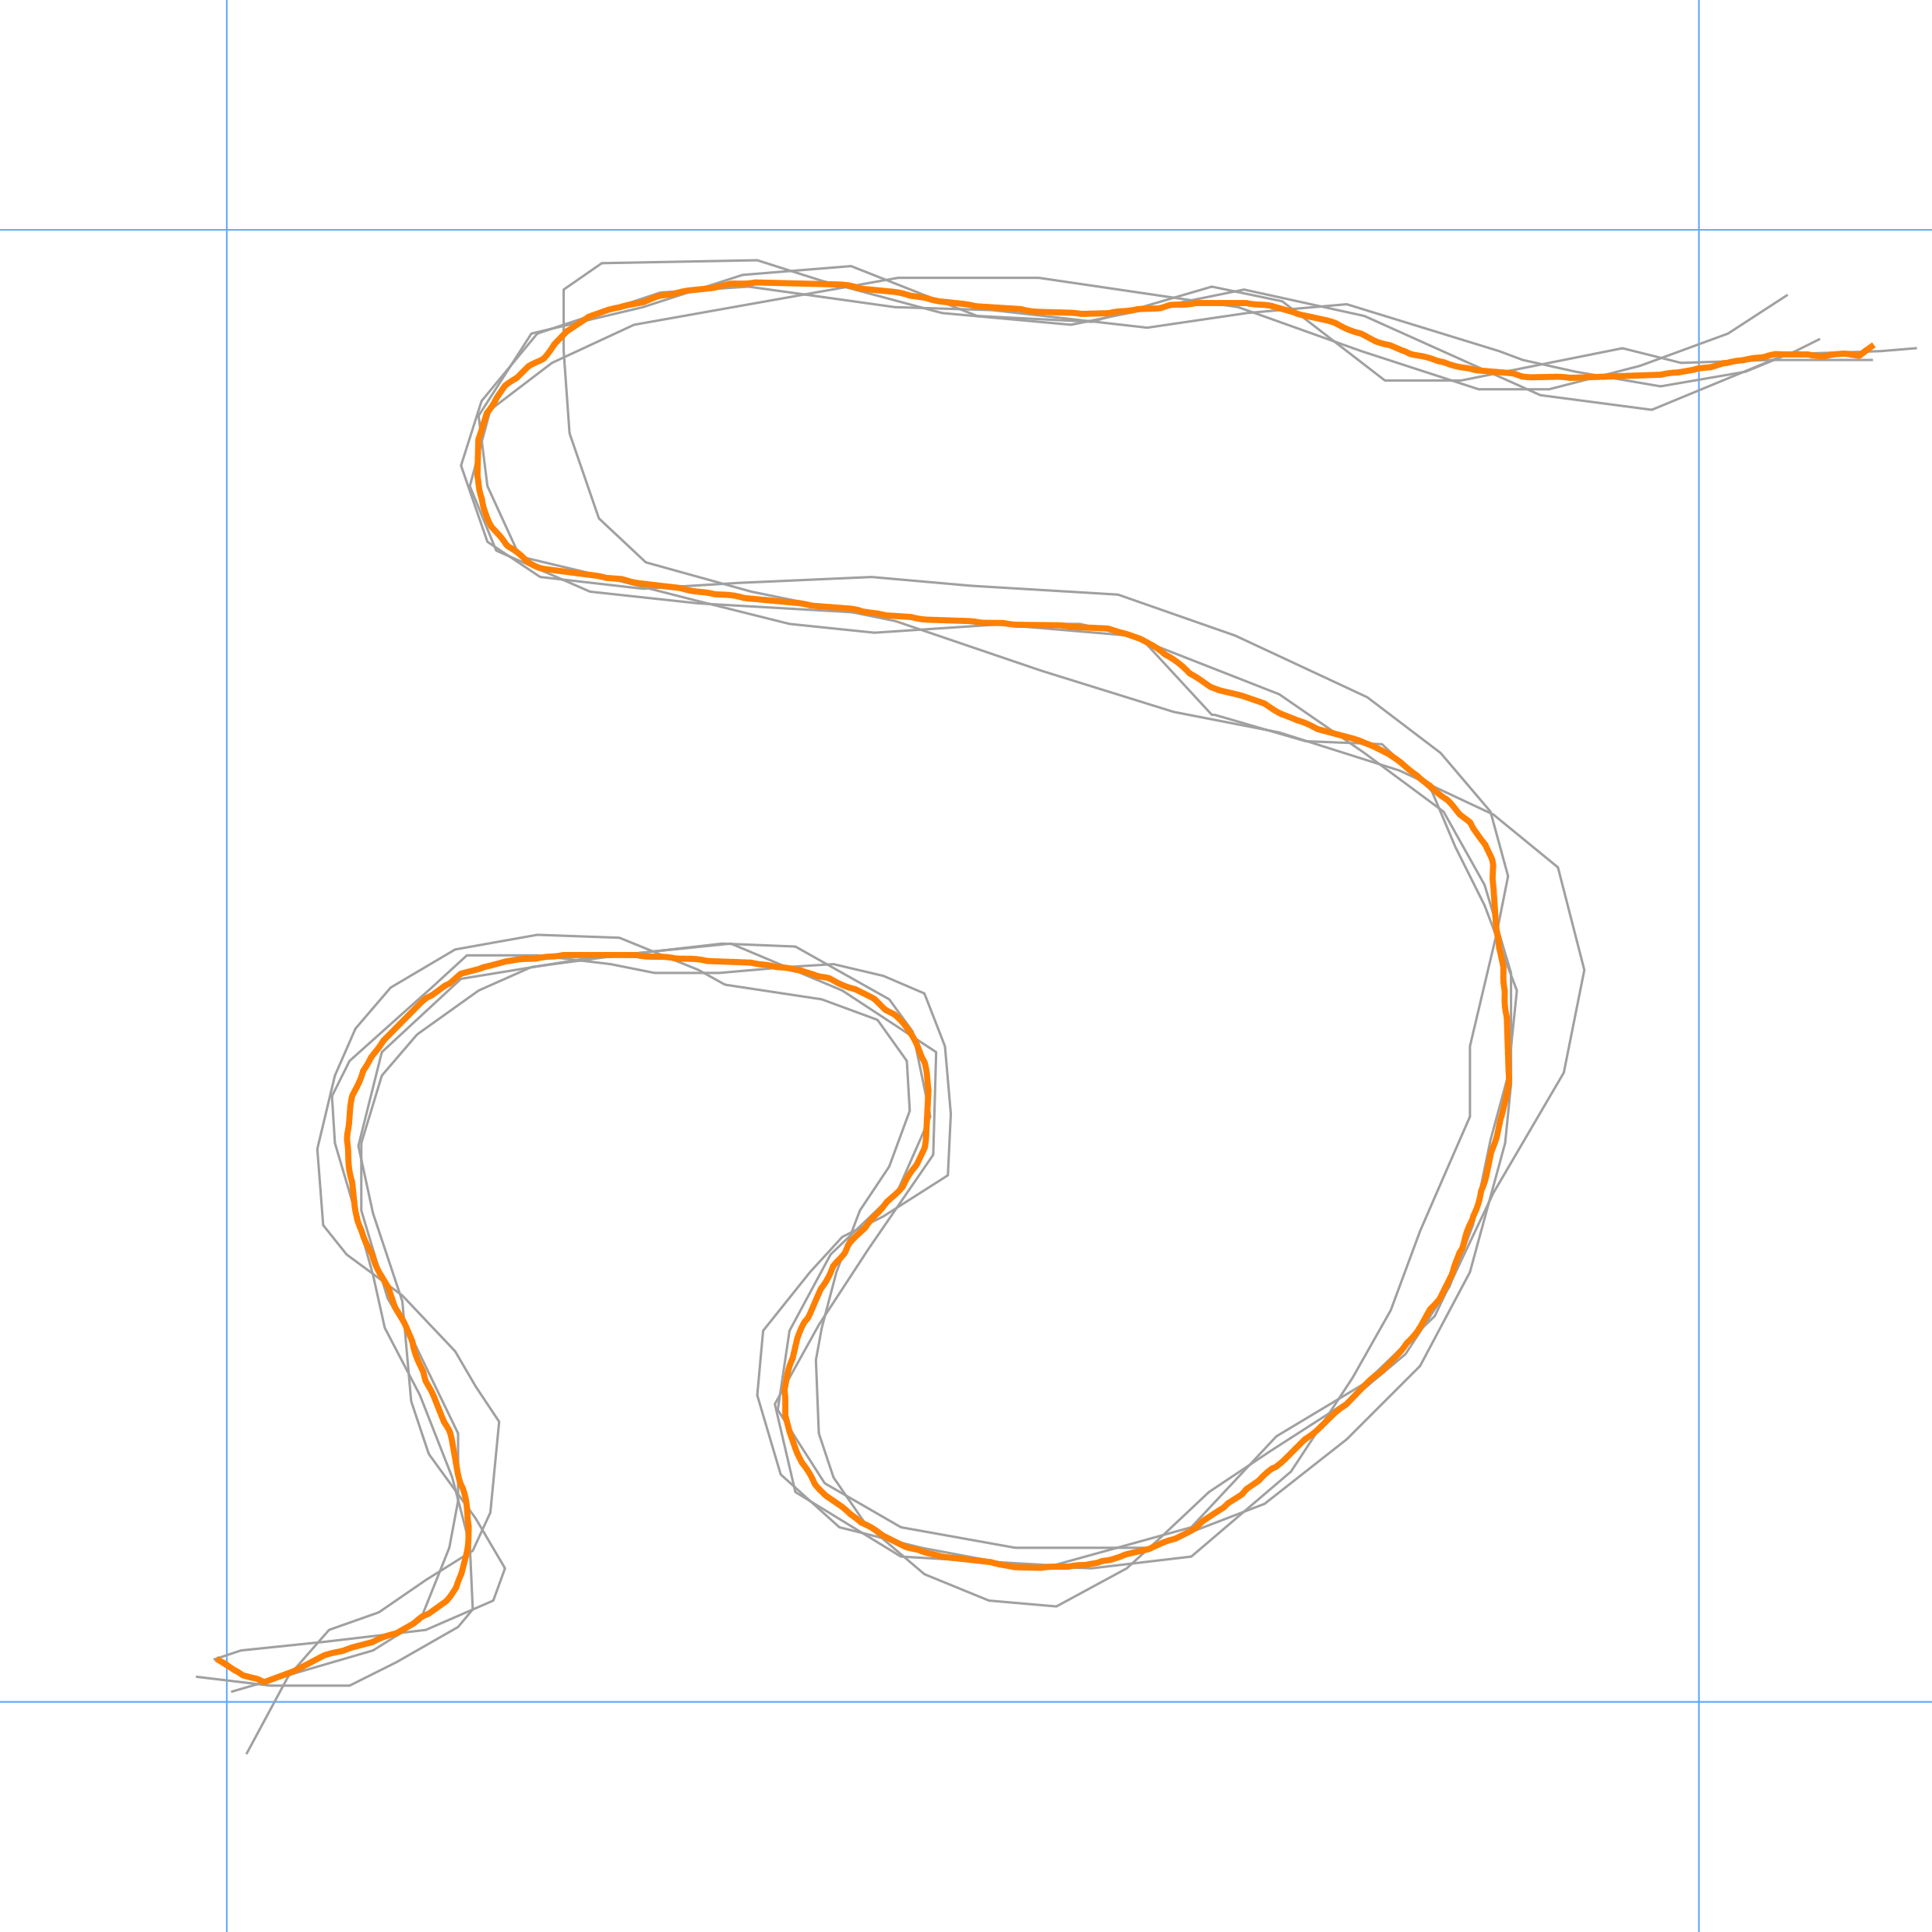
enter image description here

You can see that the resulting line represents more the most probable position of the trail than in my first answer. Especially for the bend in the North the mean line follows the three tracks which are more close to each other. The same for the bend in the East.

Advantages of the approach:

  • reasonable good results exclusively using QGIS

Disadvantages:

  • processing time for big data sets
  • you have to try parameters a priori (radius of heatmap, min/max values )
  • hard to automate the processing steps
  • not tested for narrow bends/curves and for tracks which really step out of the line

If someone can optimize the processing steps, your welcome!

3
  • 1
    +1. This is an effective approach to finding a "mean line." It isn't necessarily the best estimate of the correct line, however. To see why not, imagine that most paths were traversed very quickly, but one was traversed extremely slowly, slow enough that errors at any location would have averaged out. This single path would provide the most reliable representation of the truth, but by resampling each path this information would be lost and averaged in with the many poorer representations. Obviously this is an extreme case, but in reality some paths might be better than others.
    – whuber
    Commented Feb 15, 2018 at 16:18
  • 1
    I understand. Thank you for your response. The Heat Map Plugin in QGIS provides some advanced options, where you can use weight from field. Can information like velocity (traverse slow/quick) or others to be used to weight the data in some way? The weighting could be used to improve the heat map.
    – Stefan
    Commented Feb 16, 2018 at 6:40
  • 1
    Yes, you could do that--but none of these techniques addresses the concern that the data might have a (strong positive) autocorrelation. Dealing with that would require something like a time series analysis of the individual paths.
    – whuber
    Commented Feb 16, 2018 at 14:53

Your Answer

By clicking “Post Your Answer”, you agree to our terms of service and acknowledge you have read our privacy policy.

Not the answer you're looking for? Browse other questions tagged or ask your own question.