2

I have a huge CSV file of WGS84 latitudes and longitudes, and I would like to turn these into a large image file that I can print (with each point being a pixel on the image).

What is the best way to do this?

Currently I'm planning to convert them into eastings/northings and then use imagemagick to print a circle at each point, following the approach taken by this author (in the imagemagick script at the bottom of the post).

But I'm wondering if there's a simpler way. I'm not a GIS expert, and perhaps there's even a dedicated geospatial library for doing this?

UPDATE

As requested, here's a sample of the data. The points are all within the UK, but they don't form a regular grid.

Time,latitude,longitude
2014-12-27 18:35:10,51.7438644,-2.2094204
2014-12-27 18:34:08,51.7438657,-2.2094219
2014-12-27 18:33:06,51.7438657,-2.2094219
2014-12-27 18:32:04,51.7438689,-2.2094198
2014-12-27 18:31:03,51.7438716,-2.2094109
2014-12-27 18:30:01,51.7438537,-2.2094211

FURTHER UPDATE

To clarify, I'm looking for a large image that I can print. The points aren't on a regular grid: I was hoping that I could turn each point into a single black pixel on a transparent background.

9
  • 1
    What GIS software do you (want to) use?
    – Mapperz
    Commented Dec 30, 2014 at 15:16
  • Can you edit your question and provide some more info please. Are the points equally spaced (do they form a regular grid) or are they unevenly distributed? Can you provide a small sample so we can see the format?
    – user2856
    Commented Dec 31, 2014 at 8:45
  • @Mapperz I'm a professional developer but have no access to GIS software (except what I can install for free!). Ideally I would prefer to use something command-line, I have GDAL installed already.
    – Richard
    Commented Dec 31, 2014 at 16:39
  • @Luke thanks for following up - I've added a sample of the data. (The Time field can safely be ignored.)
    – Richard
    Commented Dec 31, 2014 at 16:43
  • If the points aren't a regular grid then how can each point be a pixel? What values do you want at the pixel locations? And you seem to have coincident points (2 and 3 differ only by Time). What to do with those?
    – Spacedman
    Commented Dec 31, 2014 at 16:57

3 Answers 3

2

Using QGIS, the simpliest way is to load the data as delimited text, select EPSG:4326 WGS84 as CRS and save the result with Project -> Save as image.

The Raster -> Conversion -> Rasterize function is a bit more sophisticated, but since your points are close to each other, it needs reprojecting to a projected CRS like UTM zone 10 first to get a reasonable cell size. You need an extra integer column for the cell content as well. Unfortunately, the min/max points are skipped with this method.

Another option is Vector -> Research Tools -> Vector grid around the canvas extent with the option Create as polygons and a cellsize greater 0.1 meters, then run Vector -> Analyze -> Points in polygons on it, and finally Raster -> Conversion -> Rasterize on the polygon layer.

A third chance is to use the SAGA Shape to grid module from the processing toolbox. Keep an eye on the cellsize, the default is too big.

2
  • Thanks. Unfortunately the QGis option only seems to export a tiny image - I'm looking for a big one that I can print... I might try this option: anitagraser.com/2010/11/30/…
    – Richard
    Commented Jan 1, 2015 at 14:36
  • 1
    Print Composer in QGis actually works pretty well.
    – Richard
    Commented Jan 1, 2015 at 22:44
2

Since the points don't form a regular grid you could use gdal_rasterize.

Set up a VRT header like so:

<OGRVRTDataSource>
    <OGRVRTLayer name="test">
        <SrcDataSource>test.csv</SrcDataSource> 
    <GeometryType>wkbPoint</GeometryType> 
    <GeometryField encoding="PointFromColumns" x="longitude" y="latitude" z="Time"/> 
    </OGRVRTLayer>
</OGRVRTDataSource>

GDAL won't write directly to PNG, but can create them by copying existing rasters, so output to a tiff first.

gdal_rasterize -ot byte -burn 255 -burn 100 -burn 100 -burn 255 -tr 0.01 0.01 -l test test.vrt test.tif

The above command creates a 4 band tiff with the first three bands showing the points in a light red (RGB 255 100 100), you can use any RGB value you want and the fourth band will be used as the PNG transparency (alpha) channel.

You will want to play with the -tr parameters, 0.01 0.01 is roughly 1.1km x 1.1km pixels in WGS84 decimal degrees. You could use the -ts width height parameter instead to specify the number of rows/columns in the output.

Then convert your tiff to a transparent PNG:

gdal_translate -of png -mask 4 test.tif test.png
3
  • Thanks for this. Yes, the time field can be ignored, I just want an image of all the points. Sounds like gdal_rasterize is the way to go?
    – Richard
    Commented Jan 1, 2015 at 14:21
  • (I just want a PNG image, not a raster. Is there a difference?)
    – Richard
    Commented Jan 1, 2015 at 22:41
  • @Richard, A png IS one of many many many raster formats ;) See edits for step by step.
    – user2856
    Commented Jan 2, 2015 at 4:04
2

Here's a fully reproducible example with output:

set.seed(310366) # so we get the same random numbers
library(raster)
uk = getData("GADM",country="GBR", level=0)
bbox(uk) # tells us the bounds (I think it goes as far west as Rockall)
# make 200 points over that area:
pts = cbind(runif(200,-13,1), runif(200,50,60))

That code has done the basic setup.

Now make a 100x100 raster with the approx bounds. Set them right for the grid you want:

r = raster(xmn=-14,xmx=1.8,ymn=49,ymx=61, ncol=100,nrow=100)

If you want transparent, then proceed, otherwise first set all cells to zero with r[]=0.

Now set any cells with a point in them to 1:

r[cellFromXY(r,pts)]=1
plot(r)
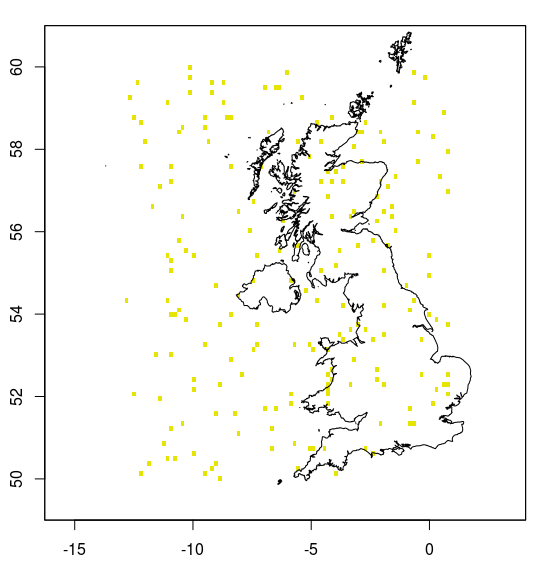
plot(uk,add=TRUE)

100x100 raster over UK

Of course if you do this with 1000x1000 the pixels will be small and you won't see much unless you have a lot of points.

To create a PNG with transparency, first make a GeoTiff:

writeRaster(r, "uk.tif", format="GTiff", overwrite=TRUE, datatype="INT2U")

Then use ImageMagick "convert" at the shell prompt to create a PNG with white made transparent:

convert -transparent white uk.tif uk.png

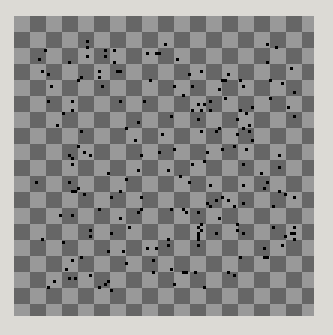
Ignore the unknown tag warnings - convert doesn't understand the extra geo-bits of the Tiff. Result, transparent PNG, here zoomed in against a chequerboard:

transparent png

what more do you want?

2
  • Thanks for this answer, but I just tried it and got a solid yellow block with x and y axes covering the latitude and longitude ranges... not what I was looking for! Thanks anyway.
    – Richard
    Commented Jan 1, 2015 at 22:42
  • I reckon that's because either your xy coordinates and your raster limits weren't right and you've got a raster of all zeroes, or your pixels are so small you can't see them. I'll add a fully reproducible example with image later..
    – Spacedman
    Commented Jan 2, 2015 at 7:57

Your Answer

By clicking “Post Your Answer”, you agree to our terms of service and acknowledge you have read our privacy policy.

Not the answer you're looking for? Browse other questions tagged or ask your own question.