3

I am new to ArcMap.

I have polygon layer, which represents buildings, and each polygon has number of inhabitants in Attribute table. Then, i have a layer which shows noise levels in the area, represented also by polygons. I would like to compute population exposure to those noise levels. What would be the best way to do that? Is it possible? Each building's facade is affected by more noise levels.
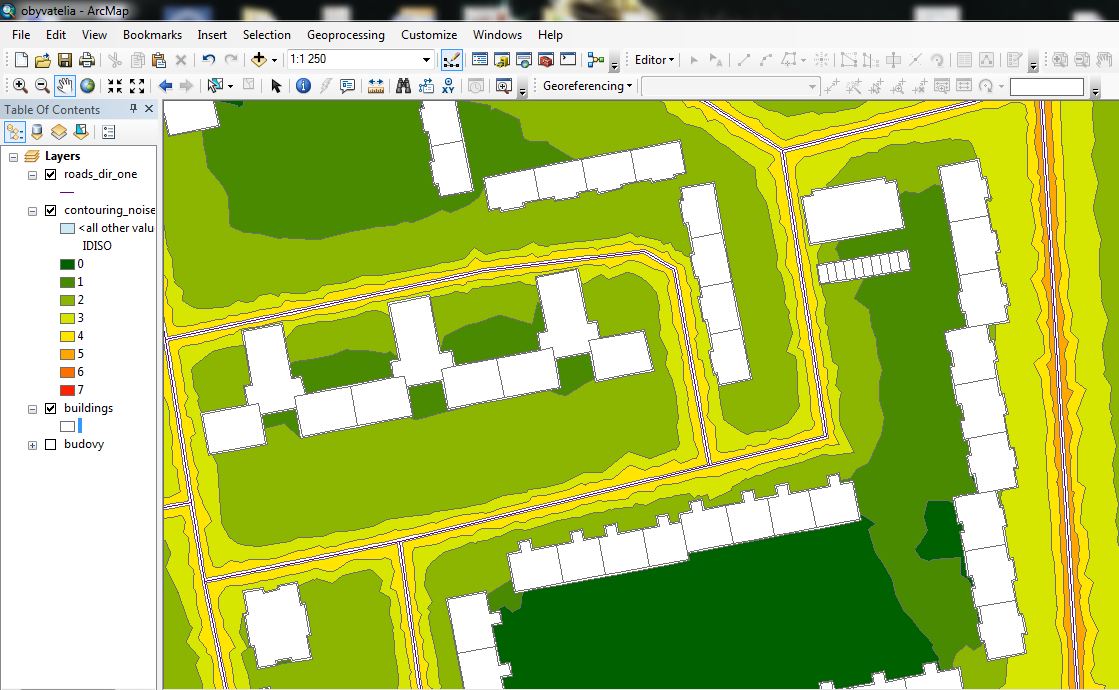
situation

1
  • 3
    This is a bit tricky. The answers below will work and in different ways, but be careful about 'accurate' or how you present your results. If you have just a single pop attribute for a building, you cannot distinguish how many of those people are on one façade vs another. At best you can say x buildings times their population are exposed to noise level one, and the same for the other levels. The sum of people for all levels would be greater than the total population though (which may be ok and what you're after). Just be aware of what your analysis is actually saying or generalizing.
    – Chris W
    Commented Feb 12, 2015 at 23:10

3 Answers 3

4

If I understood you correctly, you can use a function that joins polygons by location. I did this in QGIS using Join by location but there should be an equivalent function in ArcGIS.

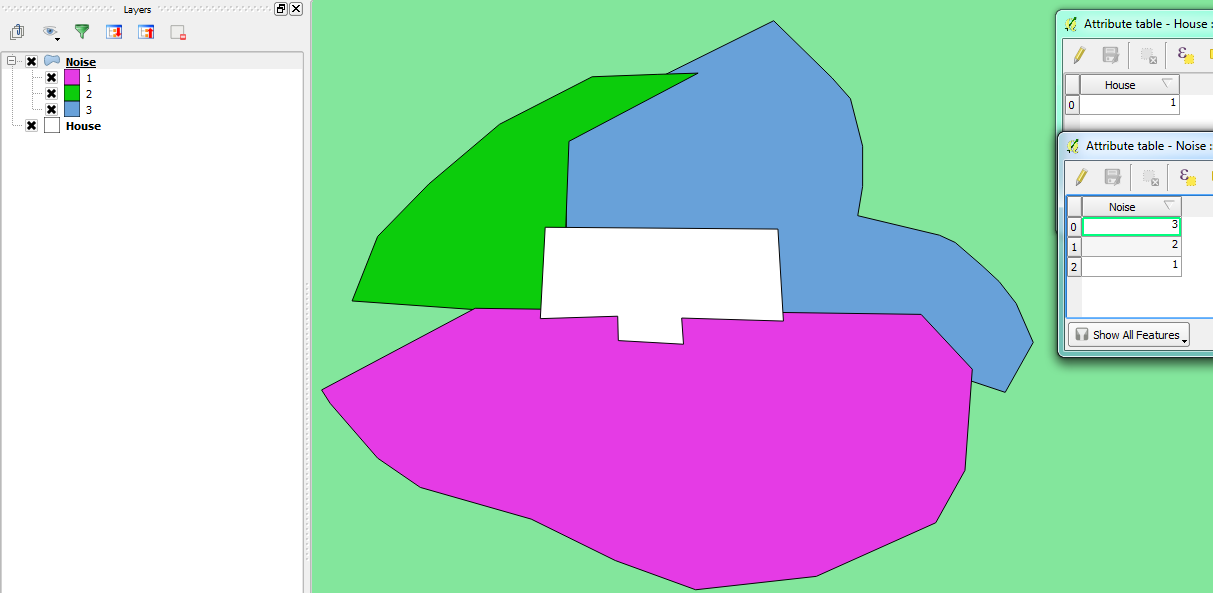
I made a simple example with 2 polygons: "House" and "Noise". The House polygon touches all 3 noise levels from the Noise layer:

House and Noise

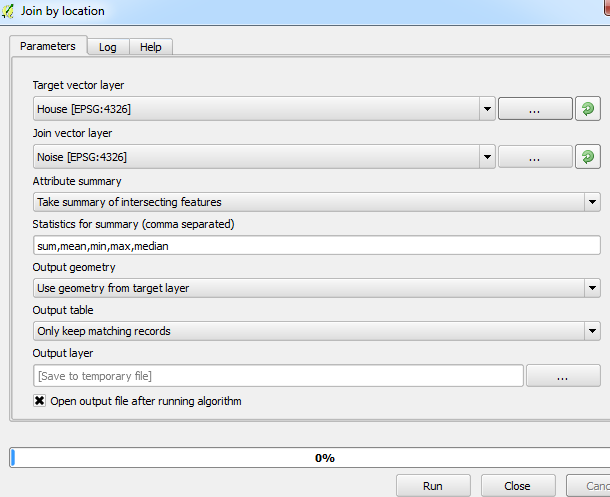
I then used the Join by location function and selecting to take a summary of intersecting features:

Join options

The output layer should contain the attributes of the House polygon and the different Noise polygons that intersect. From the attributes, you can see the statistics of noise each household if affected by such as the total noise level, how many noise levels affect it etc.:

Attributes

As I said, ArcGIS should have this functionality available. Hope this helps, otherwise hopefully others can advise.

4
  • 1
    ArcGIS calls it a Spatial Join, but yes the functions are very similar.
    – Chris W
    Commented Feb 12, 2015 at 23:06
  • 1
    +1, but I would think MAXNoise makes more sense. If a house has exposure to noise level 1 and noise level 3, then I would consider the whole house to be exposed to noise level 3. Not noise level 4.
    – Fezter
    Commented Feb 13, 2015 at 1:35
  • @ChrisW - "Spatial Join", I knew I heard that tool before :)
    – Joseph
    Commented Feb 13, 2015 at 10:04
  • @Fezter - Ha! Yes, good point. Thank you, MAXNoise would indeed make more sense =)
    – Joseph
    Commented Feb 13, 2015 at 10:04
4

@Joseph is correct with the join, but you may want to convert the polygons to lines first, as you have said each facade is effected differently, as this will show which facade is experiencing the greatest impact. With each facade as a line, then you can do the join. Make sure you have a unique building ID which is propagated to the line segments. With the unique building ID you can then associate the calculated vales back to the building polygon, and store noise level values (min, max, mean, etc.).

5
  • Very good point Ryan! That is a much more accurate method to get the best results. Does the polygon/line conversion tool in ArcGIS also create segments at the same time or does the user, similar in QGIS, have to use another function to obtain line segments?
    – Joseph
    Commented Feb 12, 2015 at 13:47
  • 1
    Good point Joseph. I haven't used ArcGIS in some time, so I am unsure if that will be a requirement. There may be some work post conversion. Commented Feb 12, 2015 at 15:03
  • 1
    @Joseph If we're talking about Features to Lines, the segments created run from intersection to intersection of features. An isolated square will generate a single, four edge, closed polyline. Looking at the sample image here building on the middle far left, there would be one line around four sides, one (two edge) line for the overlapping corner, one for the seven sides of the northwestern protrusion, and so on. So in short, yes if you want one line per side it will take further processing.
    – Chris W
    Commented Feb 12, 2015 at 23:02
  • @ChrisW - That's brilliant, many thanks for clearing that up! The Features to Lines tool is very useful, I wonder if there's a similar tool in QGIS as I can't seem to find one.
    – Joseph
    Commented Feb 13, 2015 at 10:02
  • @Joseph Well there's Polygons to Lines under Vector > Geometry tools (I think it's still there), but if you mean something that can take both polygons and lines as input, I don't know/believe so.
    – Chris W
    Commented Feb 13, 2015 at 19:05
1

Compute population noise exposure by using interpolated data introduce error in the results.

You have to compute noise level by giving receiver points. According to NS-EN ISO 140-5 they should be placed at 2 meters in front of the building facade.

As you have used NoiseM@p and OrbisGIS to create the layer contouring_noisemap you can stick with it in order to compute population noise exposure. Use the function BR_PTGRID by providing your receivers points and retrieve the accurate sound level for each receivers.

You can find a presentation about this work P 14-15-16.

This answer will be updated when a full tutorial about this post-processing will be published.

Your Answer

By clicking “Post Your Answer”, you agree to our terms of service and acknowledge you have read our privacy policy.

Not the answer you're looking for? Browse other questions tagged or ask your own question.