5

I try to make a script to find the shortest path between two bridges in a network. The goal is to get after each calculation a line that I insert as an entity in a predefined layer.

For now, I do well at making calculations but when I change the coordinates to make another calculation nothing appears even if I hear the new entity that is inserted in my table.

from PyQt4.QtCore import *
from PyQt4.QtGui import *
from qgis.core import *
from qgis.gui import *
from qgis.networkanalysis import *

#building the graph**
vl = qgis.utils.iface.mapCanvas().currentLayer()
director = QgsLineVectorLayerDirector(vl, -1, '', '', '', 3)
properter = QgsDistanceArcProperter()
director.addProperter(properter)
crs = qgis.utils.iface.mapCanvas().mapRenderer().destinationCrs()
builder = QgsGraphBuilder(crs)

#coordinates of the Start point and endPoint** 
pStart = QgsPoint(4.820590,45.838684)
pStop = QgsPoint(4.822459,45.837933)
tiedPoints = director.makeGraph(builder, [pStart, pStop])
graph = builder.graph()

#Calculation of the shortest path**    
tStart = tiedPoints[0]
tStop = tiedPoints[1]

idStart = graph.findVertex(tStart)
idStop = graph.findVertex(tStop)

(tree, cost) = QgsGraphAnalyzer.dijkstra(graph, idStart, 0)

if tree[idStop] == -1:
  print "Path not found"
else:
  p = []
  curPos = idStop
  while curPos != idStart:
    pnt = graph.vertex(graph.arc(tree[curPos]).inVertex()).point()

    p.append(pnt)
   
    curPos = graph.arc(tree[curPos]).outVertex()

  p.append(tStart)

  # Object generated after the calculation a qgsRubberBand**   
  rb = QgsRubberBand(qgis.utils.iface.mapCanvas())
  rb.setColor(Qt.red)
  
 #I build here a polyline based on the points in the p[] array
geom = QgsGeometry.fromPolyline(p)

for pnt in p:
    rb.addPoint(pnt)
    
 # I add here my result in a memory layer called cable and i want to do it for every feature i get after transforming the qgsrubberband object     

v_layer = None
for layer in QgsMapLayerRegistry.instance().mapLayers().values():
   if layer.name() == 'cable':
        v_layer = layer
if v_layer is None: 
    v_layer = QgsVectorLayer("LineString", "cable", "memory")
    v_layer.addAttribute(QgsField("id", QVariant.String))
    v_layer.addAttribute(QgsField("type", QVariant.String))
    QgsMapLayerRegistry.instance().addMapLayers([v_layer])

pr = v_layer.dataProvider()
v_layer.startEditing()


seg = QgsFeature()
seg.setGeometry(geom)
pr.addFeatures( [seg] )


v_layer.commitChanges()
4
  • I just realized that nothing was displayed because my script inserts each time the same entity in my table and not the new line created. By calculating the length of the fields I saw that it was always the same
    – hounto
    Commented Jul 4, 2017 at 12:08
  • Can you comment your code step by step with # so we can understand what you are trying to do? thank's
    – YoLecomte
    Commented Jul 4, 2017 at 13:35
  • I have already comment the code. tks
    – hounto
    Commented Jul 4, 2017 at 13:46
  • Why do you use a QgsRubberBand?
    – YoLecomte
    Commented Jul 4, 2017 at 14:29

1 Answer 1

4

Your code is working for me without a problem. I've tried it in the QGIS Python Console.

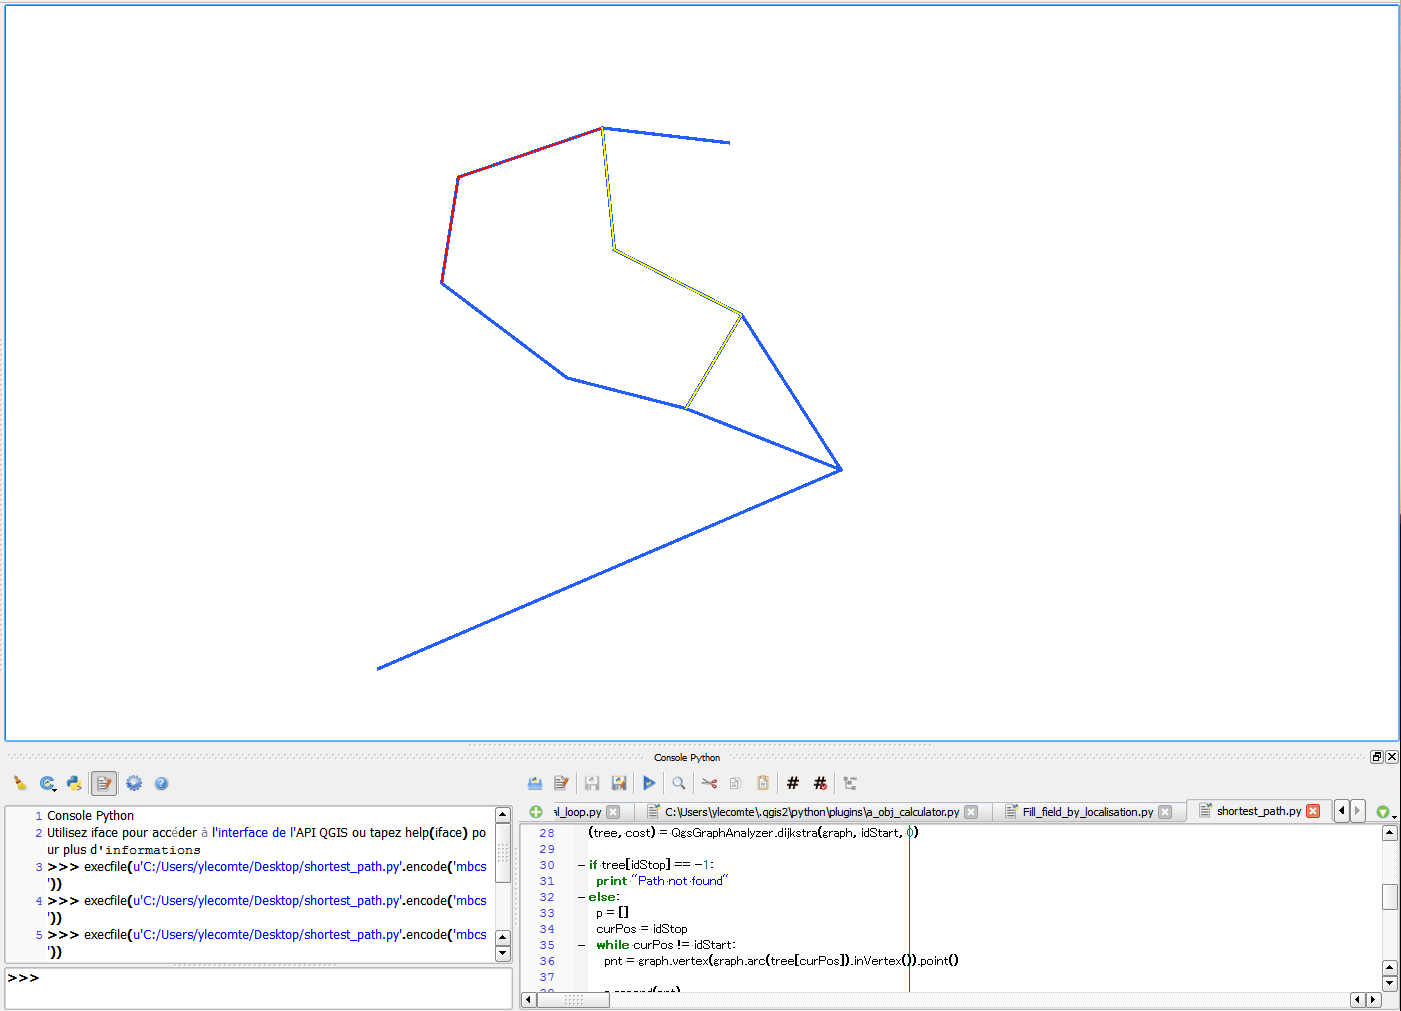
When I run it with a first start and end point, I get the red line in the cable layer then I run the script with other start and end points and I get the yellow line added in the same layer.

enter image description here

and what I get in the attribute table (length and geom calculated with the field calculator) enter image description here

I just removed the part of the code using QgsRubberBand as it was useless.

The code I used:

from PyQt4.QtCore import *
from PyQt4.QtGui import *
from qgis.core import *
from qgis.gui import *
from qgis.networkanalysis import *

#building the graph**
vl = qgis.utils.iface.mapCanvas().currentLayer()
director = QgsLineVectorLayerDirector(vl, -1, '', '', '', 3)
properter = QgsDistanceArcProperter()
director.addProperter(properter)
crs = qgis.utils.iface.mapCanvas().mapRenderer().destinationCrs()
builder = QgsGraphBuilder(crs)

#coordinates of the Start point and endPoint** 
pStart = QgsPoint(-1.041,0.916)
pStop = QgsPoint(-0.813,0.152)
tiedPoints = director.makeGraph(builder, [pStart, pStop])
graph = builder.graph()

#Calculation of the shortest path**    
tStart = tiedPoints[0]
tStop = tiedPoints[1]

idStart = graph.findVertex(tStart)
idStop = graph.findVertex(tStop)

(tree, cost) = QgsGraphAnalyzer.dijkstra(graph, idStart, 0)

if tree[idStop] == -1:
  print "Path not found"
else:
  p = []
  curPos = idStop
  while curPos != idStart:
    pnt = graph.vertex(graph.arc(tree[curPos]).inVertex()).point()

    p.append(pnt)

    curPos = graph.arc(tree[curPos]).outVertex()

  p.append(tStart)

 #I build here a polyline based on the points in the p[] array
geom = QgsGeometry.fromPolyline(p)


 # I add here my result in a memory layer called cable and i want to do it for every feature i get after transforming the qgsrubberband object     

v_layer = None
for layer in QgsMapLayerRegistry.instance().mapLayers().values():
   if layer.name() == 'cable':
        v_layer = layer
if v_layer is None: 
    v_layer = QgsVectorLayer("LineString", "cable", "memory")
    v_layer.addAttribute(QgsField("id", QVariant.String))
    v_layer.addAttribute(QgsField("type", QVariant.String))
    QgsMapLayerRegistry.instance().addMapLayers([v_layer])

pr = v_layer.dataProvider()
v_layer.startEditing()


seg = QgsFeature()
seg.setGeometry(geom)
pr.addFeatures( [seg] )


v_layer.commitChanges()
7
  • I used your code but still get the same problem. i dn't understnd why? which coordinates of points du yo use?
    – hounto
    Commented Jul 4, 2017 at 17:15
  • I just change the pStart and pStop coordinate ans run the script again
    – YoLecomte
    Commented Jul 4, 2017 at 17:46
  • It is exactly what i did.i get the feature but they are not displayed and have the same lenght
    – hounto
    Commented Jul 4, 2017 at 18:04
  • Are you sure your cable layer is not below other? This may explain the fact that nothing is display. The two length you're suppose to get are really différent? Add screenshots might help...
    – YoLecomte
    Commented Jul 4, 2017 at 18:31
  • Sometimes it works sometimes it does not. Sometimes i get Dum error. i will try untill tommorow and let you know. How can i do if i want to get the start point and the end point just by clicking on the screen. how can i build a useful plug in using this script. Do you get some idea? thanks
    – hounto
    Commented Jul 4, 2017 at 19:01

Your Answer

By clicking “Post Your Answer”, you agree to our terms of service and acknowledge you have read our privacy policy.

Not the answer you're looking for? Browse other questions tagged or ask your own question.