2

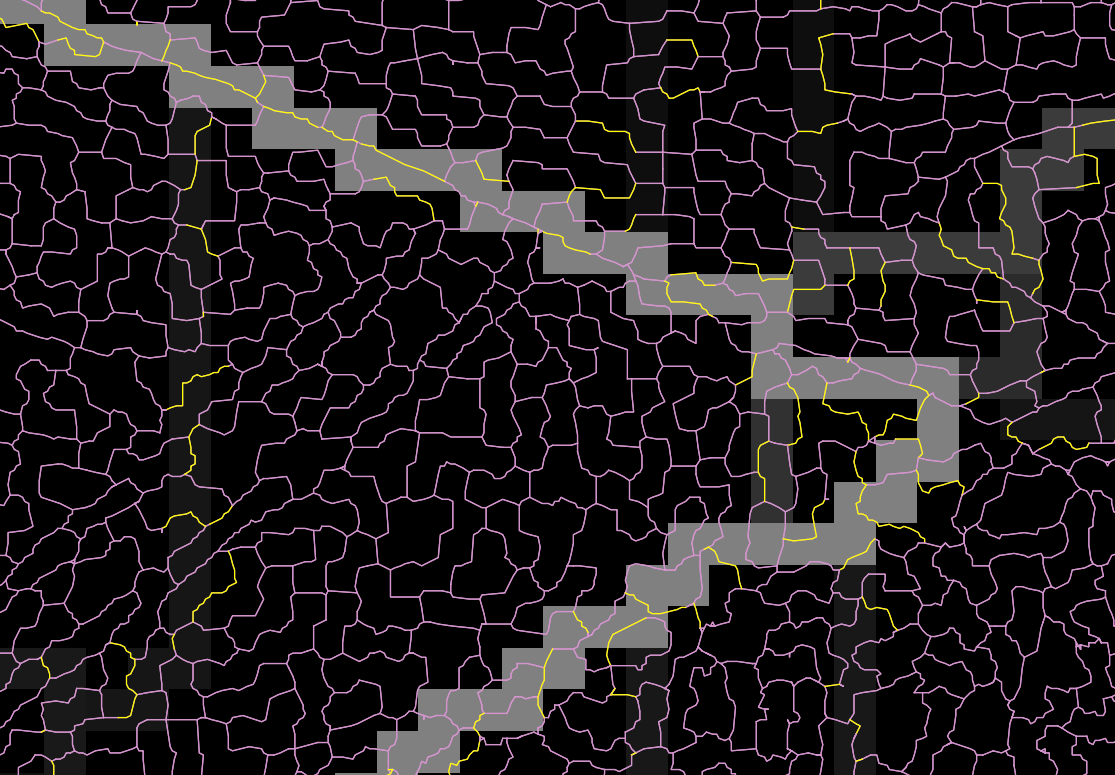
I would like to assign the average of all raster pixels laying under a vector line as an attribute to the vector line. So the mean of the grey/white pixels to each of the red line segments in the following image: enter image description here
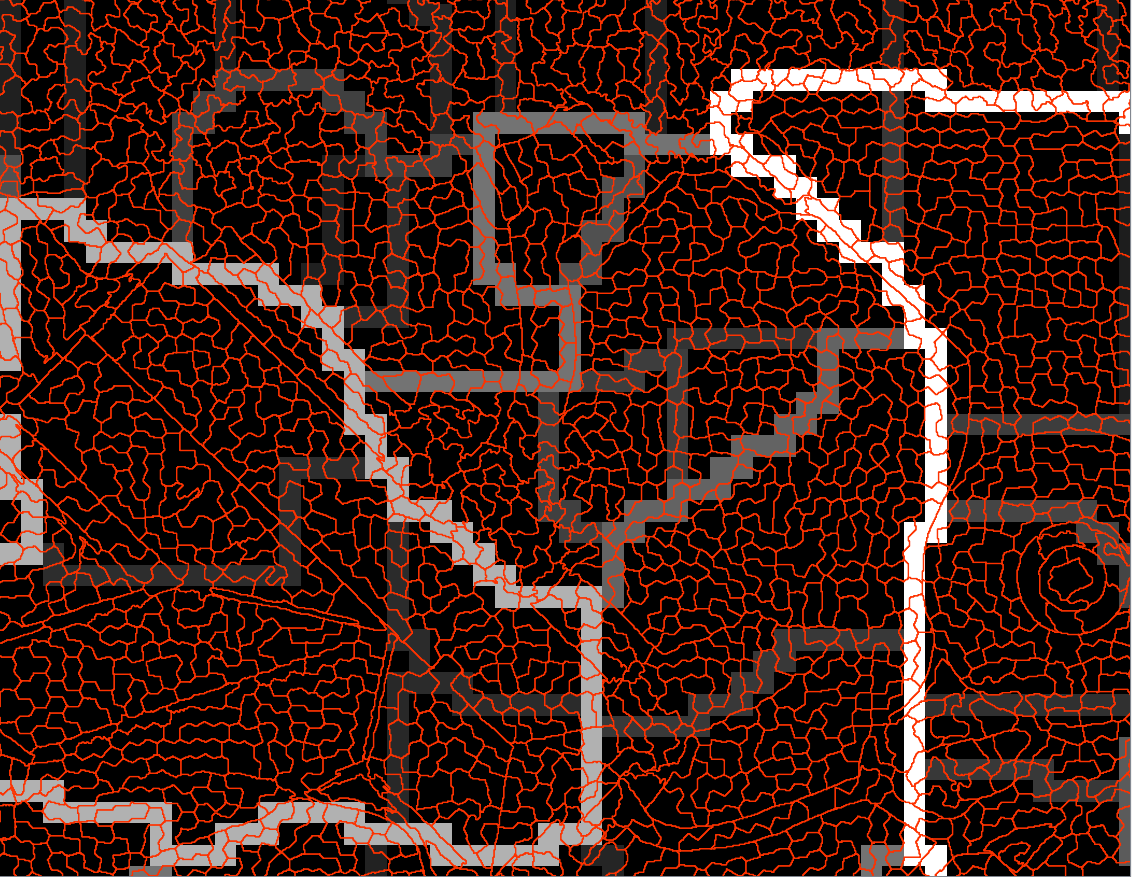
I have found solutions to assign raster values to points and polygons link1 link2 link3, but not for lines. Here what I have tested so far:

  1. To buffer the lines, calculate zonal statistics per buffer segment and join the attributes by location with the original lines. This seems quiet time-consuming.

  2. To convert each pixel to a point and assign its value to the closest line using v.distance . Here, I haven't figures out, how to update the distance to a 'dist' column of my line layer. I will open a new question for this (link to question).

  3. To apply the GRASS module v.rast.stats. With the following command, some values from the raster map were attached to the red lines. However this update only worked for a limited number of lines (yellow lines in image). I don't know why the raster information is not updated to all lines.

    processing.runalg('grass7:v.rast.stats', {"map": red_lines, "raster": rlayer, "column_prefix": "ucm", "method": 'median', "GRASS_REGION_PARAMETER": "%f,%f,%f,%f" % (xmin, xmax, ymin, ymax), "GRASS_OUTPUT_TYPE_PARAMETER":3, "output": red_lines_update})

enter image description here

My main question is if I have overseen any more straight-forward way to solve this.

1
  • You can try convert raster to vector and intersect it.
    – Frodo
    Commented Sep 20, 2017 at 18:53

1 Answer 1

2

As @nagib suggests, one way to solve this is to convert the raster to a point vector file and join the mean attributes values of those points to each line based on the (intersecting) location of each point. This is done by searching for all points within a specific buffer around each line, averaging their attribute values and adding these to each line segment.

Here the corresponding implementation in PyQGIS:

# Convert raster to point vector
processing.runalg('grass7:r.to.vect',
                      {"input": rlayer,
                       "type": 1,
                       "GRASS_REGION_PARAMETER": "%f,%f,%f,%f" % (xmin, xmax, ymin, ymax),
                       "GRASS_OUTPUT_TYPE_PARAMETER": 1,
                       "output": raster_points})

# Join attributes by location
processing.runalg('qgis:joinattributesbylocation',
                      {"TARGET": red_lines,
                       "JOIN": raster_points,
                       "PREDICATE": u'intersects',  
                       "PRECISION": 1,              # searches for all points in a 1m radius
                       "SUMMARY": 1,                # takes the summary (=avg?) of all points in the radius
                       "STATS": 'mean',
                       "KEEP": 0,                   # all records are kept
                       "OUTPUT": red_lines_update})

A second option would be to append the value of one point to its nearest line(s) with v.distance: This would be done by converting the raster to a point vector as before, adding a raster-value-column to the line layer and running:

processing.runalg('grass7:v.distance',
                    {"from": red_lines,
                    "to": raster_points,
                    "dmax": '-1',
                    "dmin": '-1',
                    "upload": 'to_attr',
                    "column": 'raster_val',
                    "to_column": 'value',
                    "GRASS_REGION_PARAMETER": "%f,%f,%f,%f" % (xmin, xmax, ymin, ymax),
                    "from_output": red_lines_update})

The disadvantage of this approach is that only one (nearest) point is taken into account, while the first approach finds a summary of all points lying in a (user-defined) radius around each line.

Your Answer

By clicking “Post Your Answer”, you agree to our terms of service and acknowledge you have read our privacy policy.

Not the answer you're looking for? Browse other questions tagged or ask your own question.