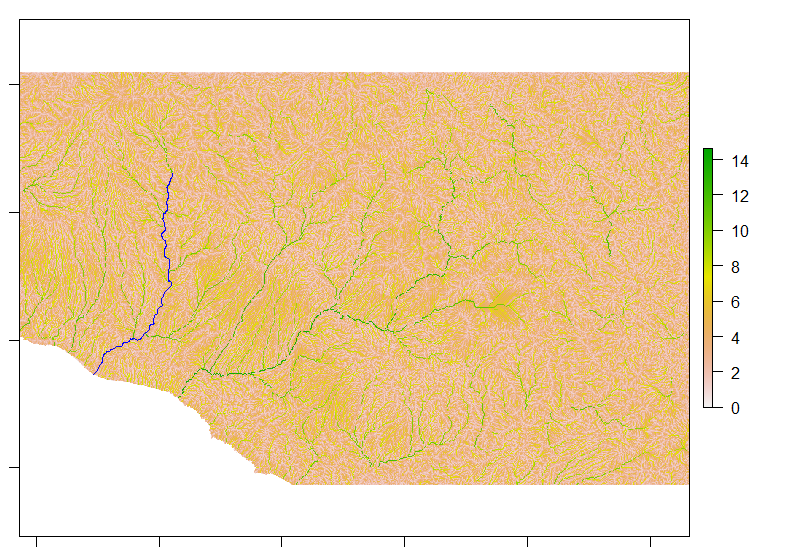
I am having some trouble with tauDEM that I am hoping someone can give me some advice on. I'm running tauDEM via command line through R-studio. I am working with some 30m resolution SRTM DEM data in geographic projection to do some very simple hydrology GIS:
DEM pit-filling > flow direction > flow accumulation
In doing this though, I end up with NA's (not 0's) all the way down some (but only some) major rivers.
I tried burning in one of the streams since it is happening in along a very flat meandering/braided river floodplain in one case. This did not help. I tried running D-infinity algorithms instead of D8, on both a burned/non-burned DEMs and got the same result. If I bring in the resulting flow accumulation to ArcGIS and zoom in on it, I can SEE the river clearly as a line of NA's!
I don't know what is going on. I don't think it is running out of bit depth for the number of accumulated cells since it is being stored as a 32-bit raster (I don't know how to control this either). The DEM is not very large in file size (~48mb) and the process is completed very quickly on my Windows 10 PC: Dell Precision 7510, Intel 4-core XEON CPU @2.9GHZ (overclocks to 3.4GHZ as needed), 64GB ram, 1TB SSD, 2TB HDD.
I am hoping someone has encountered this problem and can tell me what is going on. Links to the data are just below, followed by my R code. I attached a couple plots of the resulting log(flow accumulation) including one with a missing major river plotted in blue.
#Set working directory
setwd("enter_WD_with_data_here")

#Load some packages
require(rgdal)

require(raster)

require(sp)

# Get DEM data and a shapefile
DEM <- raster("DEM.tif") # DEM is in geographic coordinates

Rio_Majes <- shapefile("Rio_Majes.shp") # this is a shapefile I delineated of one of the missing rivers

#Pit-fill the DEM with tauDEM
system("mpiexec -n 8 pitremove -z DEM.tif -fel DEM_fill.tif")

filled_DEM=raster("DEM_fill.tif")

# D8 flow directions with tauDEM
system("mpiexec -n 8 D8Flowdir -p 30m_anp.tif -sd8 30m_sd8.tif -fel DEM_fill.tif",show.output.on.console=T,invisible=F)

p=raster("30m_anp.tif")

sd8=raster("30m_sd8.tif")

# D8 contributing area in tauDEM
system("mpiexec -n 8 AreaD8 -p 30m_anp.tif -ad8 30m_ad8.tif")

ad8=raster("30m_ad8.tif")

anp_d8=raster("30m_anp.tif")

plot(log(ad8)) #this plot is pretty chaotic, but it tells us a bit

#Focal means plot to highlight problem of missing streams with flow accumulation
avg_mat <- matrix(1, ncol=9, nrow=9)

avg_facc <- focal(ad8,w=avg_mat,fun=mean, na.rm=T, filename="avg_facc.tif") #this plot may seem dumb, but "avg_facc" is used for subsequent analyses

avg_facc=raster("avg_facc.tif")

plot(log(avg_facc)) #here is a decent plot of drainages

par(mfrow=c(1,1), new=TRUE) #this lets us add the shapefile to the plot in the right place. The plot looks good in  the console, but messes up if you "zoom" in Rstudio. Exported plots are fine.

plot(Rio_Majes, add=T, col="blue", lwd=1) #with this shapefile added we see where a river channel was/is absent

#Plot of focal average Log D8 flow accumulation

[![enter image description here][3]][3]

#Plot of focal average Log D8 flow accumulation with shapefile added

