I've been using R with Leaflet and Shiny to produce a web map that is accessible to the public online. It is a real-time air temperature map of Tasmania, Australia based on current Bureau or meteorology weather station observations. You can view a prototype here: http://144.6.226.103/shiny/
Each air temperature map is referenced from GeoServer via WMS. I have produced the R code below for reference.
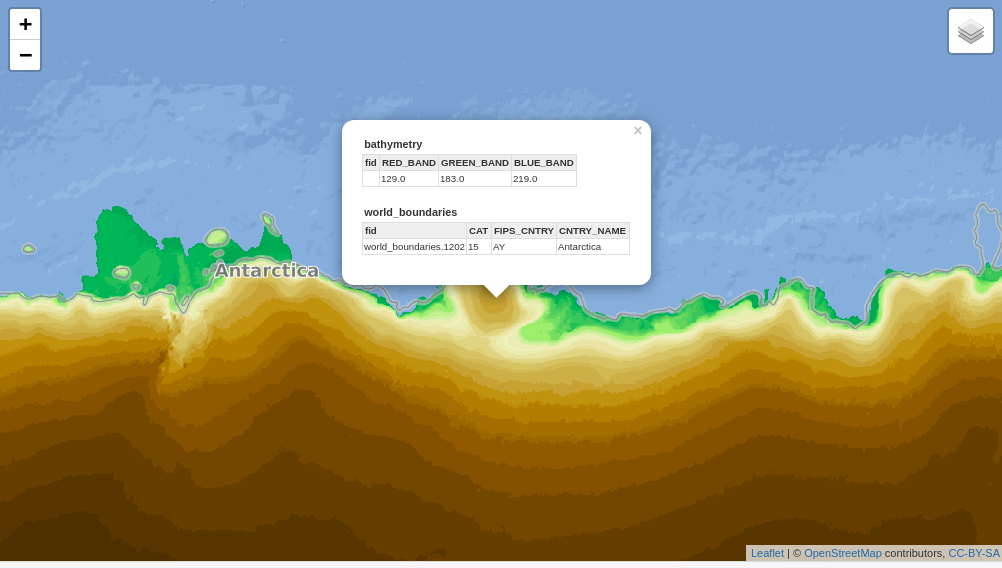
I'm trying to enable the GETFeatureInfo function so users are able to query each map spatially by clicking on any location thereby producing a popup and showing a temperature value.
I'm wondering if this is possible to set up in R?
library(leaflet)
library(raster)
library(htmlwidgets)
library(leaflet.extras)
    m<-leaflet() %>% addTiles() %>% setView(147, -42, zoom = 8) %>%
            addWMSTiles(
              "http://144.6.226.103:8080/geoserver/TempPred/wms?service=WMS",
              layers = paste0("TempPrediction_2019090511AEST"),
              group = paste0("TempPrediction_2019090511AEST"),
              options = WMSTileOptions(format = "image/png", transparent = TRUE, version ="1.3.0",opacity = 0.5))%>%
            addWMSTiles(
              "http://144.6.226.103:8080/geoserver/TempPred/wms?service=WMS",
              layers = paste0("TempPrediction_2019090510AEST"),
              group = paste0("TempPrediction_2019090510AEST"),
              options = WMSTileOptions(format = "image/png", transparent = TRUE, version ="1.3.0",opacity = 0.5))%>%
            addWMSTiles(
              "http://144.6.226.103:8080/geoserver/TempPred/wms?service=WMS",
              layers = paste0("TempPrediction_2019090509AEST"),
              group = paste0("TempPrediction_2019090509AEST"),
              options = WMSTileOptions(format = "image/png", transparent = TRUE, version ="1.3.0",opacity = 0.5))%>%
            addWMSTiles(
              "http://144.6.226.103:8080/geoserver/TempPred/wms?service=WMS",
              layers = paste0("TempPrediction_2019090508AEST"),
              group = paste0("TempPrediction_2019090508AEST"),
              options = WMSTileOptions(format = "image/png", transparent = TRUE, version ="1.3.0",opacity = 0.5))%>%
            addWMSTiles(
              "http://144.6.226.103:8080/geoserver/TempPred/wms?service=WMS",
              layers = paste0("TempPrediction_2019090507AEST"),
              group = paste0("TempPrediction_2019090507AEST"),
              options = WMSTileOptions(format = "image/png", transparent = TRUE, version ="1.3.0",opacity = 0.5))%>%
            addWMSTiles(
              "http://144.6.226.103:8080/geoserver/TempPred/wms?service=WMS",
              layers = paste0("TempPrediction_2019090506AEST"),
              group = paste0("TempPrediction_2019090506AEST"),
              options = WMSTileOptions(format = "image/png", transparent = TRUE, version ="1.3.0",opacity = 0.5))%>%
            addWMSLegend(uri=paste0('http://144.6.226.103:8080/geoserver/TempPred/ows?service=WMS&request=GetLegendGraphic&format=image%2Fpng&width=20&height=20&layer=TempPrediction_2019090511AEST'))%>%
            addLayersControl(
              baseGroups = c(paste0("TempPrediction_2019090511AEST (°C)"),paste0("TempPrediction_2019090510AEST (°C)"),paste0("TempPrediction_2019090509AEST (°C)"),paste0("TempPrediction_2019090508AEST (°C)"),paste0("TempPrediction_2019090507AEST (°C)"),paste0("TempPrediction_2019090506AEST (°C)")),
              position = 'bottomleft',
              options = layersControlOptions(collapsed = FALSE))


addWMS()the WMS-layer is not visible. If I useaddWMSTiles()I don't get the getFeatureInfo Informations. Has anyone implemeted it correctly? My code, copied from trevis post: ``` library(shiny) library(leaflet) library(leaflet.extras2) library(XML) ui <- fluidPage( # Application title titlePanel("Test"), mainPanel( leafletOutput("mymap") ) ) server <- function(input, output) { output$mymap <- renderLeaflet({leaflet() %>% addTiles(group = "base") %>% addWMS(baseUrl = "ows.terrestris.de/osm/service", layers = c("TOPO-WMS","OSM-Overlay-W