11

I am looking to create movement paths of fish based on observed locations.

Since I am looking at movements of fish within rivers and lakes, simply connecting the points to form a polyline will not work as many of the paths would be over land. I need some way to restrict the movement paths to within the water boundaries.

I am not a programmer and rely on the tools in the Arc toolbox to perform the operations. A new column in the FAT with distance between sequential points would also be useful.

I am using ArcMap 10.

Does anyone have an suggestions as to how to generate the movement paths?


A bit more information on the data; the majority of the locations are collected from remote receivers which tend to generate a lot of observations (one of my projects has over 3 million detections and growing, each detection record includea ID, datetime, lat and long). If a fish stays within the detection range of a receiver it is detected roughly once every two minutes which results in a lot of observations (points), so my first step is to average the lat and long over a time period in this case 1 day. Averaging the detections in the lake habitat typically works well, but doing so in the river portions can result in detections outside the river/lake boundary. So the first thing I need to do is "snap" the averaged locations into the River/Lake Boundary and then I would like to create a movement path that is restricted to within the river/lake boundary, ideally this path would include distance for each line segment. My rivers are polylines and the lakes are polygons, but I can convert the rivers to polygons if necessary. Alternatively, I could use the raw unaveraged data and all my detections would be in the boundary, although creating movement paths restricted to within the boundary is still problematic, but this would result in a lot of data.

The attached image shows the daily average positions for two different fish.
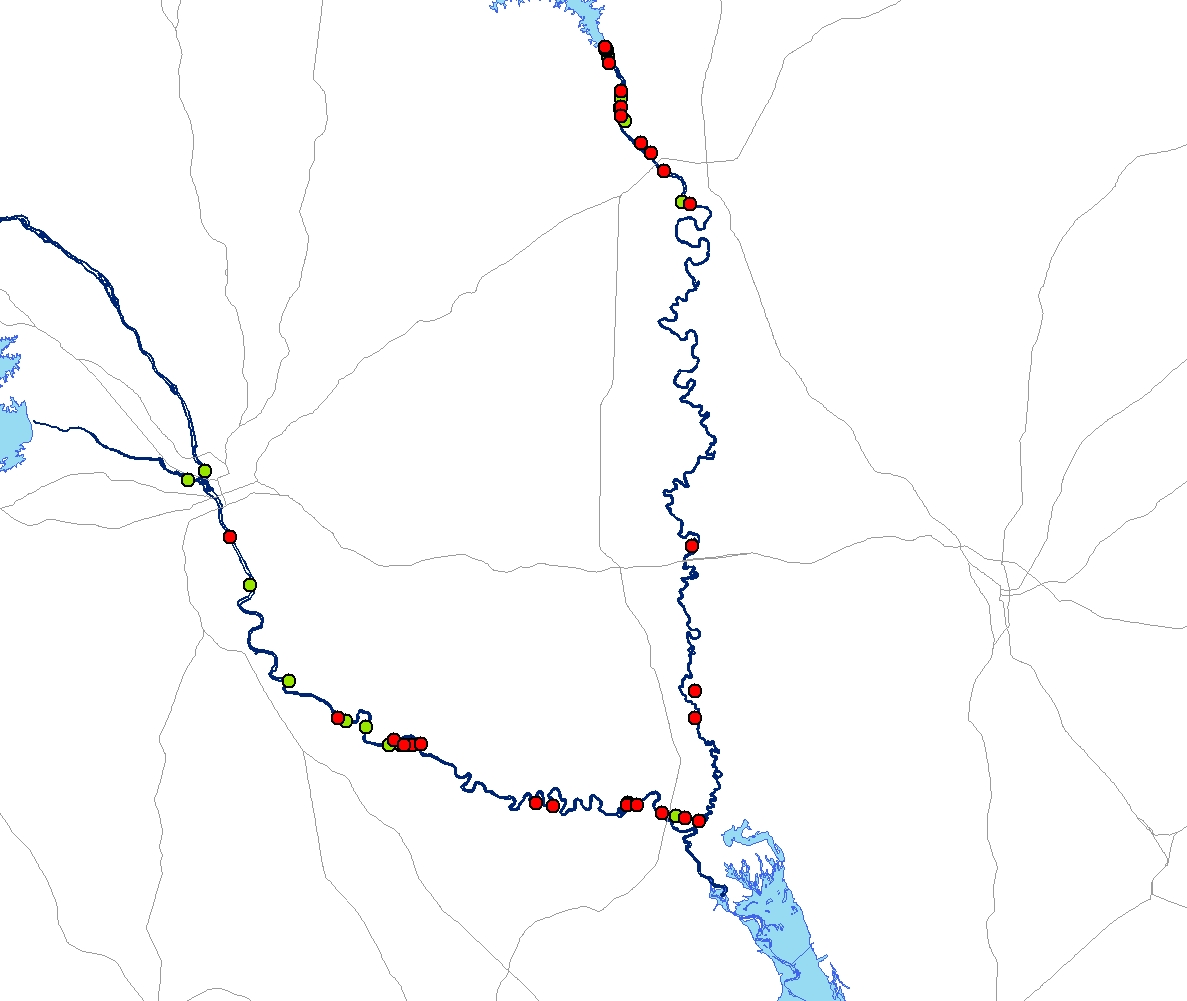
enter image description here

6
  • How dense are your observation points? I'm assuming you have at least river polygons and observation points. A crude approach I think would be to clip the observation points layer using the river polygons. That way, you would be left with the observation points that are on the river. I don't know enough about your needs though. Could you afford to lose a few points as long as a path can be drawn?
    – R.K.
    Commented Sep 19, 2012 at 16:57
  • Could you provide more details? For example, what data do you have right now? How do you get the "observed locations"?
    – R.K.
    Commented Sep 19, 2012 at 17:21
  • The river has many curves and bends so even if restrict locations to those within the river many of the generated lines would still cross outside the river boundaries, right?
    – user10320
    Commented Sep 19, 2012 at 19:30
  • Can you provide some sample data? Or a least a screenshot of the data.
    – R.K.
    Commented Sep 20, 2012 at 6:33
  • added additional information to the original post
    – user10320
    Commented Sep 20, 2012 at 15:49

5 Answers 5

3

In my view, it would be better to do the analysis using rasters (cost surfaces to be precise). A draft outline method might be:

  • Firstly merge (Data Management Tools > General > Merge) your constraints ('land') and rivers/lakes polygons together making sure that you add a field that distinguishes between the two layers (i.e. "Type" = land or waterbody).
  • Convert your merged polygon to a raster using Polygon to Raster (Conversion Tools > To Raster > Polygon to Raster). Chose an appropriate cell size that best represents your data (bearing in mind that a higher resolution will result in a larger file and will invariably impact upon processing time) and deliminate a processing extent using Geoprocessing > Environments > Processing extent.
  • Reclassify your raster to Boolean to restrict the analysis to water areas only i.e. 0=land, 1=waterbody
  • Convert your fish locations to a raster, making sure that you maintain the same cell resolution and extent and that the locations are identifiable using a reclassify if necessary (i.e. use 2s and 1s)
  • I would then utilise a cost surface (simply, a raster of the same resolution and extent, that represents the 'cost' of travelling across a cell). This raster might simply consist of a uniform value (in which case, the shortest route would be selected as optimal) or, better yet, perhaps flow rates or turbidity which better reflects the environment through which the fish are travelling (in which case the least cost accumulated path would be optimal). See Cost Distance - Spatial Analyst > Distance > Cost Distance).
  • Finally, use Cost Path (Cost Path - Spatial Analyst > Distance > Cost Path) to identify the least cost path from your source to destination (observed location) cells.
2
  • This sounds promising, but I don't have much experience with raster data. My study area is roughly 600 km^2 if I used 100 m cells this would result in 6 million cells. If a average my location detections by day I have roughly 42,000 location records for my 60 study animals. Does this still seem like a good approach or would it be too data intensive.
    – user10320
    Commented Sep 20, 2012 at 15:35
  • 1
    I'd argue that the raster approach was more suited to data intensive procedures than vector alternatives. It might be good practice to split the method per species (i.e. 60 separate cost maps). This will make the datasets more manageable but an obvious trade off is the extra time needed to repeat experiments. A poignant question might be; are 100 m cells a good surrogate for the data that you're using? By this I mean, taking into account the cumulative measurement and spatial errors inherent in your datasets, is this cell size the best fit? Reducing cell size will decrease processing time.
    – veedub
    Commented Sep 21, 2012 at 8:49
2

If the rivers are lines:

A good approach to deal with such issues is linear referencing. It is quite complex, but offers many possibilities. There is a lot of information about linear referencing in the ArcGIS Help. Lock at Linear referencing scenarios and Linear referencing sample applications to see which possibilities linear referencing gives to you.

Some of the tools you have to use are:

Create Routes

Locate Features Along Routes

Make Route Event Layer

As I said, it's a complex approach and it takes time to understand the linear referencing approach (and to use it in ArcGIS), but linear referencing gives you many opportunities.

1
  • 1
    Linear referencing may be a soltion if only the highest and lowest position of a fish should be used. I guess that a fish do not swim in only one direction? A fisch swim upstream and then downstream and then upstream again and so on? Then linear referencing will not a good solution in this case.
    – Jens
    Commented Sep 21, 2012 at 10:05
1

If you convert the rivers from polygon to lines you can use Network Anlayst to analyse the fish paths.

You can do a Route analysis. The positons of a fish are the stops. There is a USE_INPUT_ORDER option for the stops, so that the stops will be visited in the input order.

Network Analyst needs a line network. I have no goog idea how to handle the polygons of the lakes. Perhaps you create a line dataset (grid of lines) inside the lakes?

0

To calculate the average positon over a time period you may try the Central Feature Tool . The result position will be inside the river.

0

You could try connecting all the points, then split polylines at vertices, and delete the land pieces intersected by the land polygon (which you can make erasing the river from the study area polygon), and then merge the remaining segments.

Your Answer

By clicking “Post Your Answer”, you agree to our terms of service and acknowledge you have read our privacy policy.

Not the answer you're looking for? Browse other questions tagged or ask your own question.