I downloaded a complete month of daily images of MODIS MOD07_L2 product (Atmospheric profile). I've worked with *.hdf files for really long (using both R and tools such as HEG), nevertheless, I am now stuck with MOD07 product. I need to work with Dew-point Temperature at different pressure levels, but I don't understand how the data is actually saved in the *.hdf layer (which is Retrieved_Moisture_Profile). I tried using HEG software with all possible options (for output file types), but none of them worked. For every iteration I tried in HEG I got the "Could not find TimeofDay attribute, CalendarDate, Sensorname, pointingangle (and many more) attribute in input hdf file". So I believe HEG is not capable to work with this type of data. The result for every image was a black square with just one pixel value.
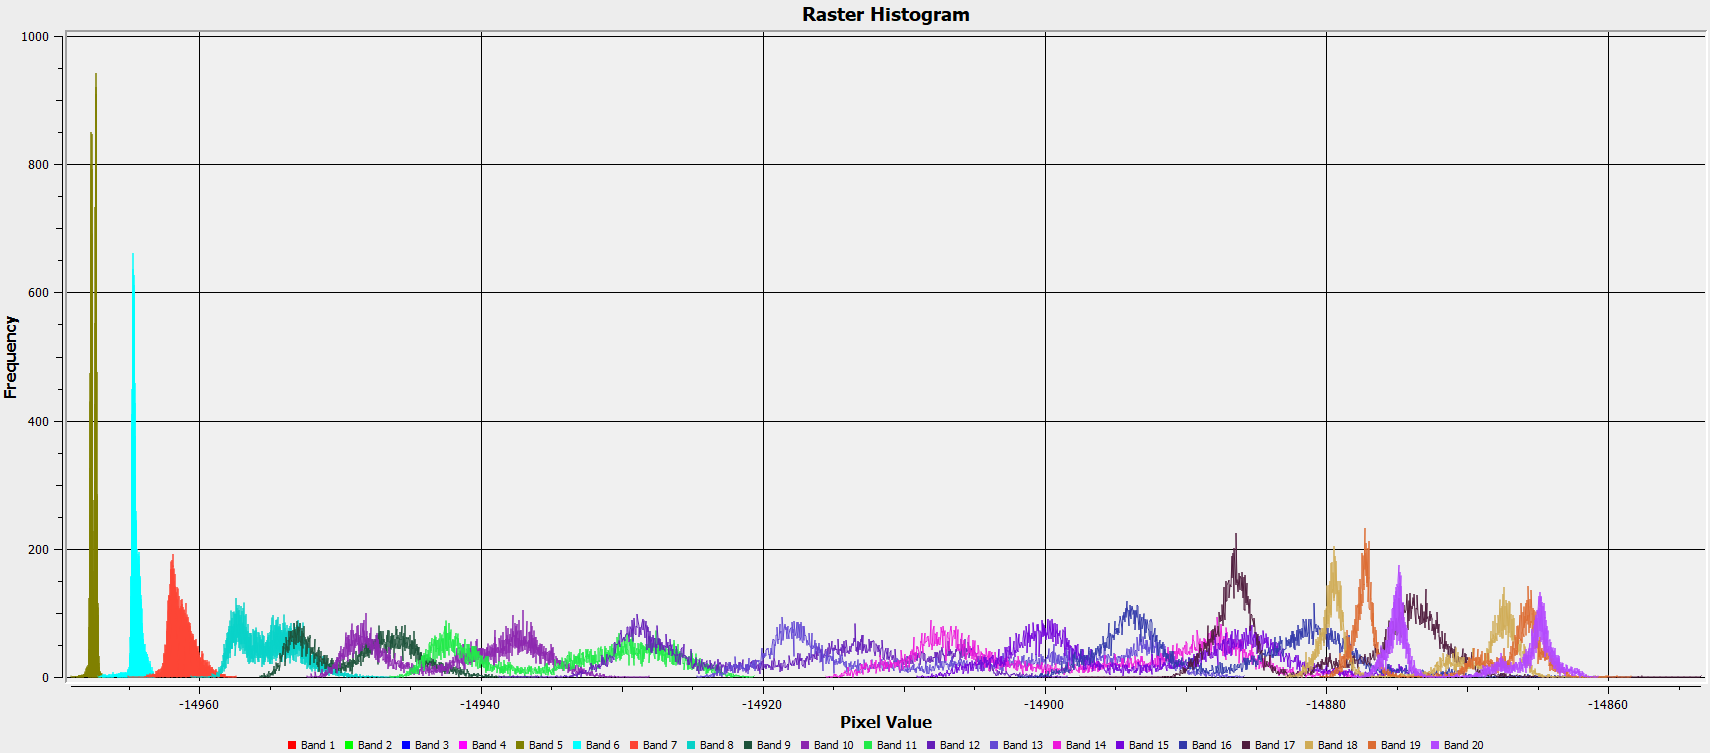
I opened the *.hdf file directly in QGIS (version 3.10.4-A Coruña) and, more specifically, I opened the Retrieved_Moisture_Profile layer. When I studied the histogram of the latter image it is quite clear that there are 20 different Dew-point temperature profiles (each of one of them is for an specific pressure level), as you can see in the following figure.
I was thinking that maybe I can just save the *.hdf to *.nc, but I tried with rhdf5 and the latter package is depricated for R version 3.6.3. I also tried opening the *.hdf file with gdalUtils, which actually works, but I couldn't find how to 'divide' each layer of the raster or even save them separately.
So, what I need is the following (in R).
- I need to open the MOD07
*.hdffile - I need to open the
Retrieved_Moisture_Profilelayer within the*.hdffile - I need to save the dew-point temperature profile for each pressure level i.e. for each 'band' (from 1 to 20), as a
GeoTIFFfile.
I'm running R version 3.6.3 in Windows 10 64 bit machine.

