You can show bar charts created by Geometry Generator even for input features whose geometry is outside the map canvas, but, as others mentioned, it is not possible by default.
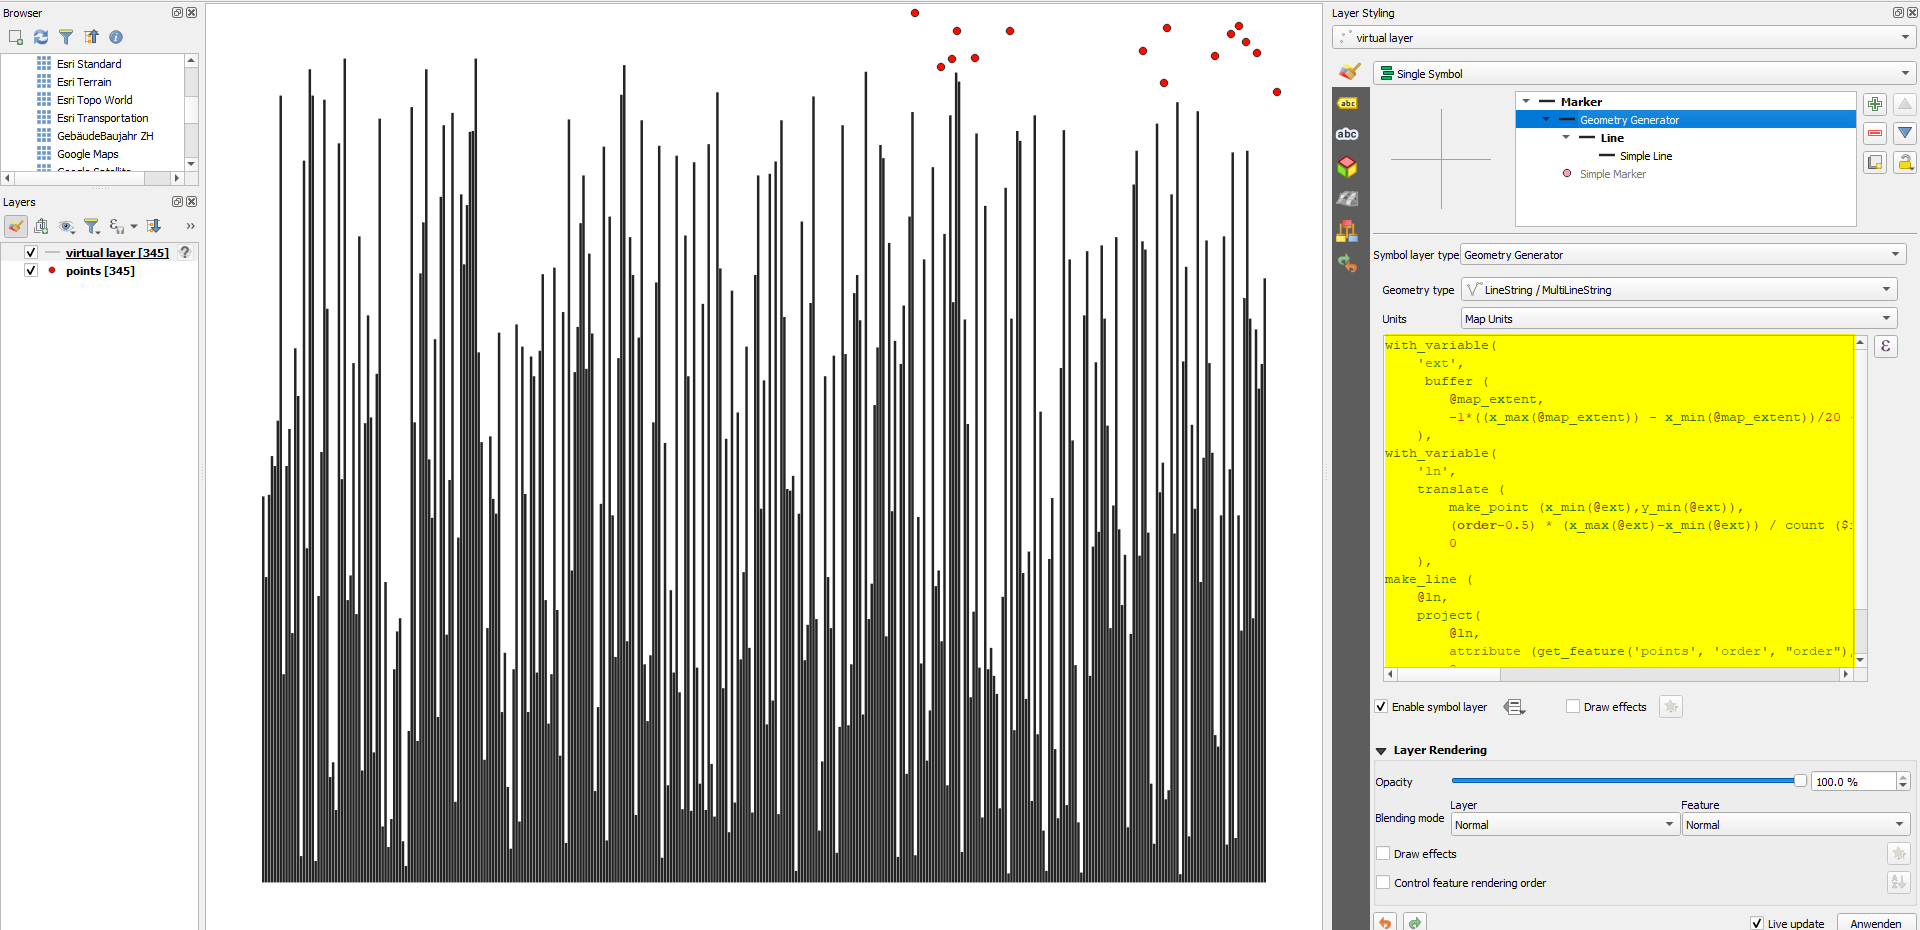
Just a few of the totally 345 points are visible in the upper right part of the map canvas, still, bar charts for all 345 points are visible. The virtual layer's Simple Marker symbol layer is set to invisible (Enable Symbol Layer box unchecked):

The basic idea is to create a virtual layer as a copy of all attributes (without the geometries) of your layer and add a geometry that for sure is inside the map canvas. Then apply the Geometry Generator expression to this virtual layer.
The tricky part is creating a point on the virtual layer that is for sure inside the map canvas as the virtual layer has no direct access to the map canvas. See here for the whole procedure or in what follows for a step by step explanation.
On the initial layer, create two new virtual fields called xmin and ymin for the current map canvas extent's x/y minimum values. Create a custom function currentExtent() for this, then calculate the values with x_min(currentExtent()) and y_min(currentExtent()).
Use these xmin/ymin values on the virtual layer to create a point at the bottom left of the map canvas. Add all the attribute fields you need to create the bar chart, here order and value. Set these fieldnames in double quotes " to mask them and like this tell the virtual layer to treat them as field names as these are special names.
The Virtual layer query looks like this:
select pts."order", pts."value", make_point (pts.xmin,pts.ymin)
from points as pts
You get a virtual layer with a point on the bottom left of your map canvas that shifts as you pan/zoom. You can delete the point marker style in the layer styling or uncheck the box Enable symbol layer, because this point is only for auxiliary purpose: we only want to show the bar charts.
Add a Geometry Generator layer style with the following expression. I silghtly modified it so that the bars do not start at the bottom left of the canvas, but a bit shifted. The area within which the bars are shown is created as a negative buffer from the map canvas. Change the value of 20 (negative buffer of 1/20 (=5%) of the map canvas size) at the end of line 5:
 with_variable(
     'ext',
      buffer (
         @map_extent,
         -1*((x_max(@map_extent)) - x_min(@map_extent))/20 -- -- change size of area for bar charts here
     ),
 with_variable(
     'ln',
     translate (
         make_point (x_min(@ext),y_min(@ext)),
         (order-0.5) * (x_max(@ext)-x_min(@ext)) / count ($id),
         0
     ),
 make_line (
     @ln,
     project(
         @ln,
         attribute (get_feature('points', 'order', "order"),'value') * (y_max(@ext)-y_min(@ext)) / maximum(value),
         0
     )
 )))
Like this, the bars will show even for the points that are outside the map canvas.


