6

I am trying to calculate habitat volume for around 30 fish stocks in Qgis. I have habitat areas (shape files) and Bathymetric information (.tif file). I believe I can calculate the entire volume of water for each habitat area using the r.volume module in the QGIS Grass plugin (after having clipped the tif file to represent each exact habitat area).

However my problem is is that my fish stocks have a specific depth range. In other words they do not swim throughout the entire volume of water in their habitat area.

My question is. I can calculate the volume of the habitat area from sea level to the floor, but how can I 'cut out' all the volume below and above the depth range of the fish stock. For example if a fish stock has a depth range of 50-200 meters, i want to cut out all the volume above 50 meters and below 200 meters.

Here are the Properties found under the layers, properties --> Metadata

Driver GDAL provider GTiff GeoTIFF

Dataset Description /Users/aninahenggeler/Documents/Humboldt/Thesis /High seas proposal/GIS & Google Earth/Bathymetry/Grid - geotiff/ETOPO1_Bed_g_geotiff FAO area 27.tif NC_GLOBAL#Conventions=COARDS/CF-1.0 NC_GLOBAL#GMT_version=4.4.0 NC_GLOBAL#history=grdreformat ETOPO1_Bed_g_gdal.grd ETOPO1_Bed_g_gmt4.grd=ni NC_GLOBAL#node_offset=0 NC_GLOBAL#title=ETOPO1_Bed_g_gmt4.grd

x#actual_range=-180, 180

x#long_name=Longitude

x#units=degrees

y#actual_range=-90, 90

y#long_name=Latitude

y#units=degrees

z#_FillValue=-2147483648

z#actual_range=-10898, 8271

z#long_name=z

Band 1

NETCDF_VARNAME=z

STATISTICS_MAXIMUM=4208

STATISTICS_MEAN=-1187.2601375688

STATISTICS_MINIMUM=-5808

STATISTICS_STDDEV=1836.8780130609

Dimensions

X: 7035 Y: 3324 Bands: 1 Origin -48.1083,89.9583 Pixel Size 0.0166667,-0.0166667 No Data Value 0

Data Type

Int16 - Sixteen bit signed integer

Pyramid overviews

Layer Spatial Reference System +proj=longlat +datum=WGS84 +no_defs

Layer Extent (layer original source projection) -48.1083333333333201,34.5583333333333584 : 69.1416666666666799,89.9583333333333428 Band Band 1 Band No 1 No Stats No stats collected yet

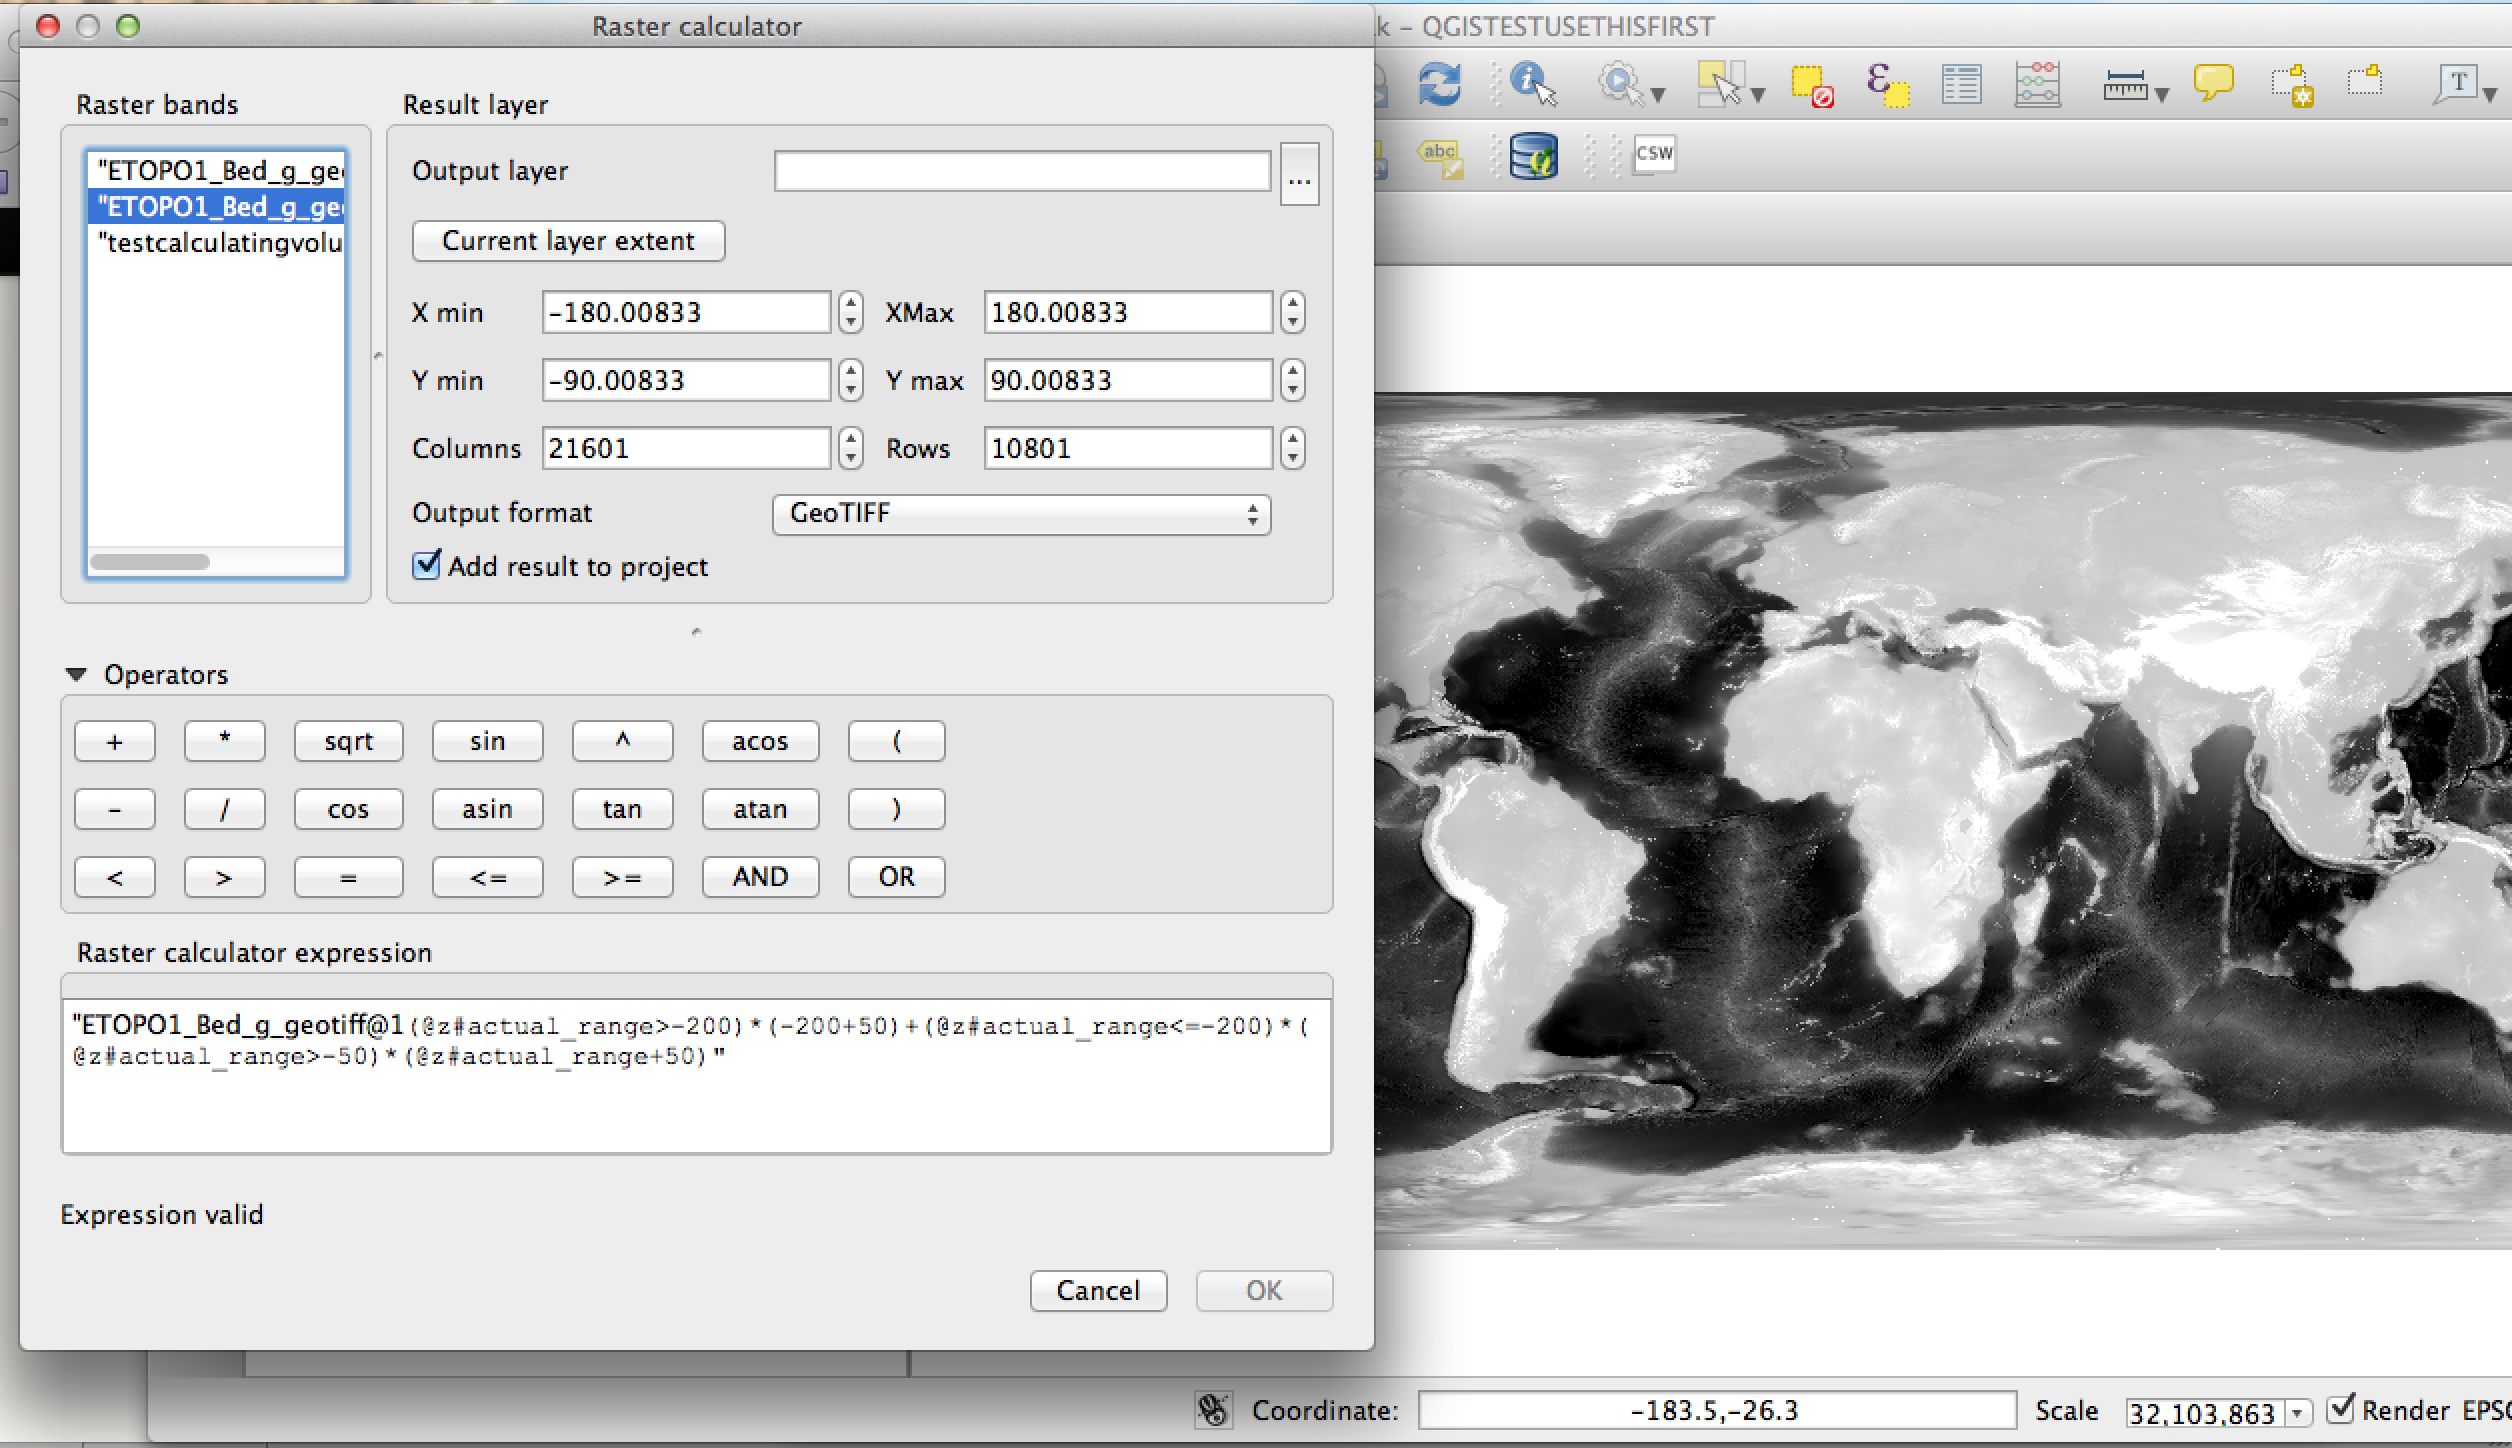
USING RASTER CALCULATOR:

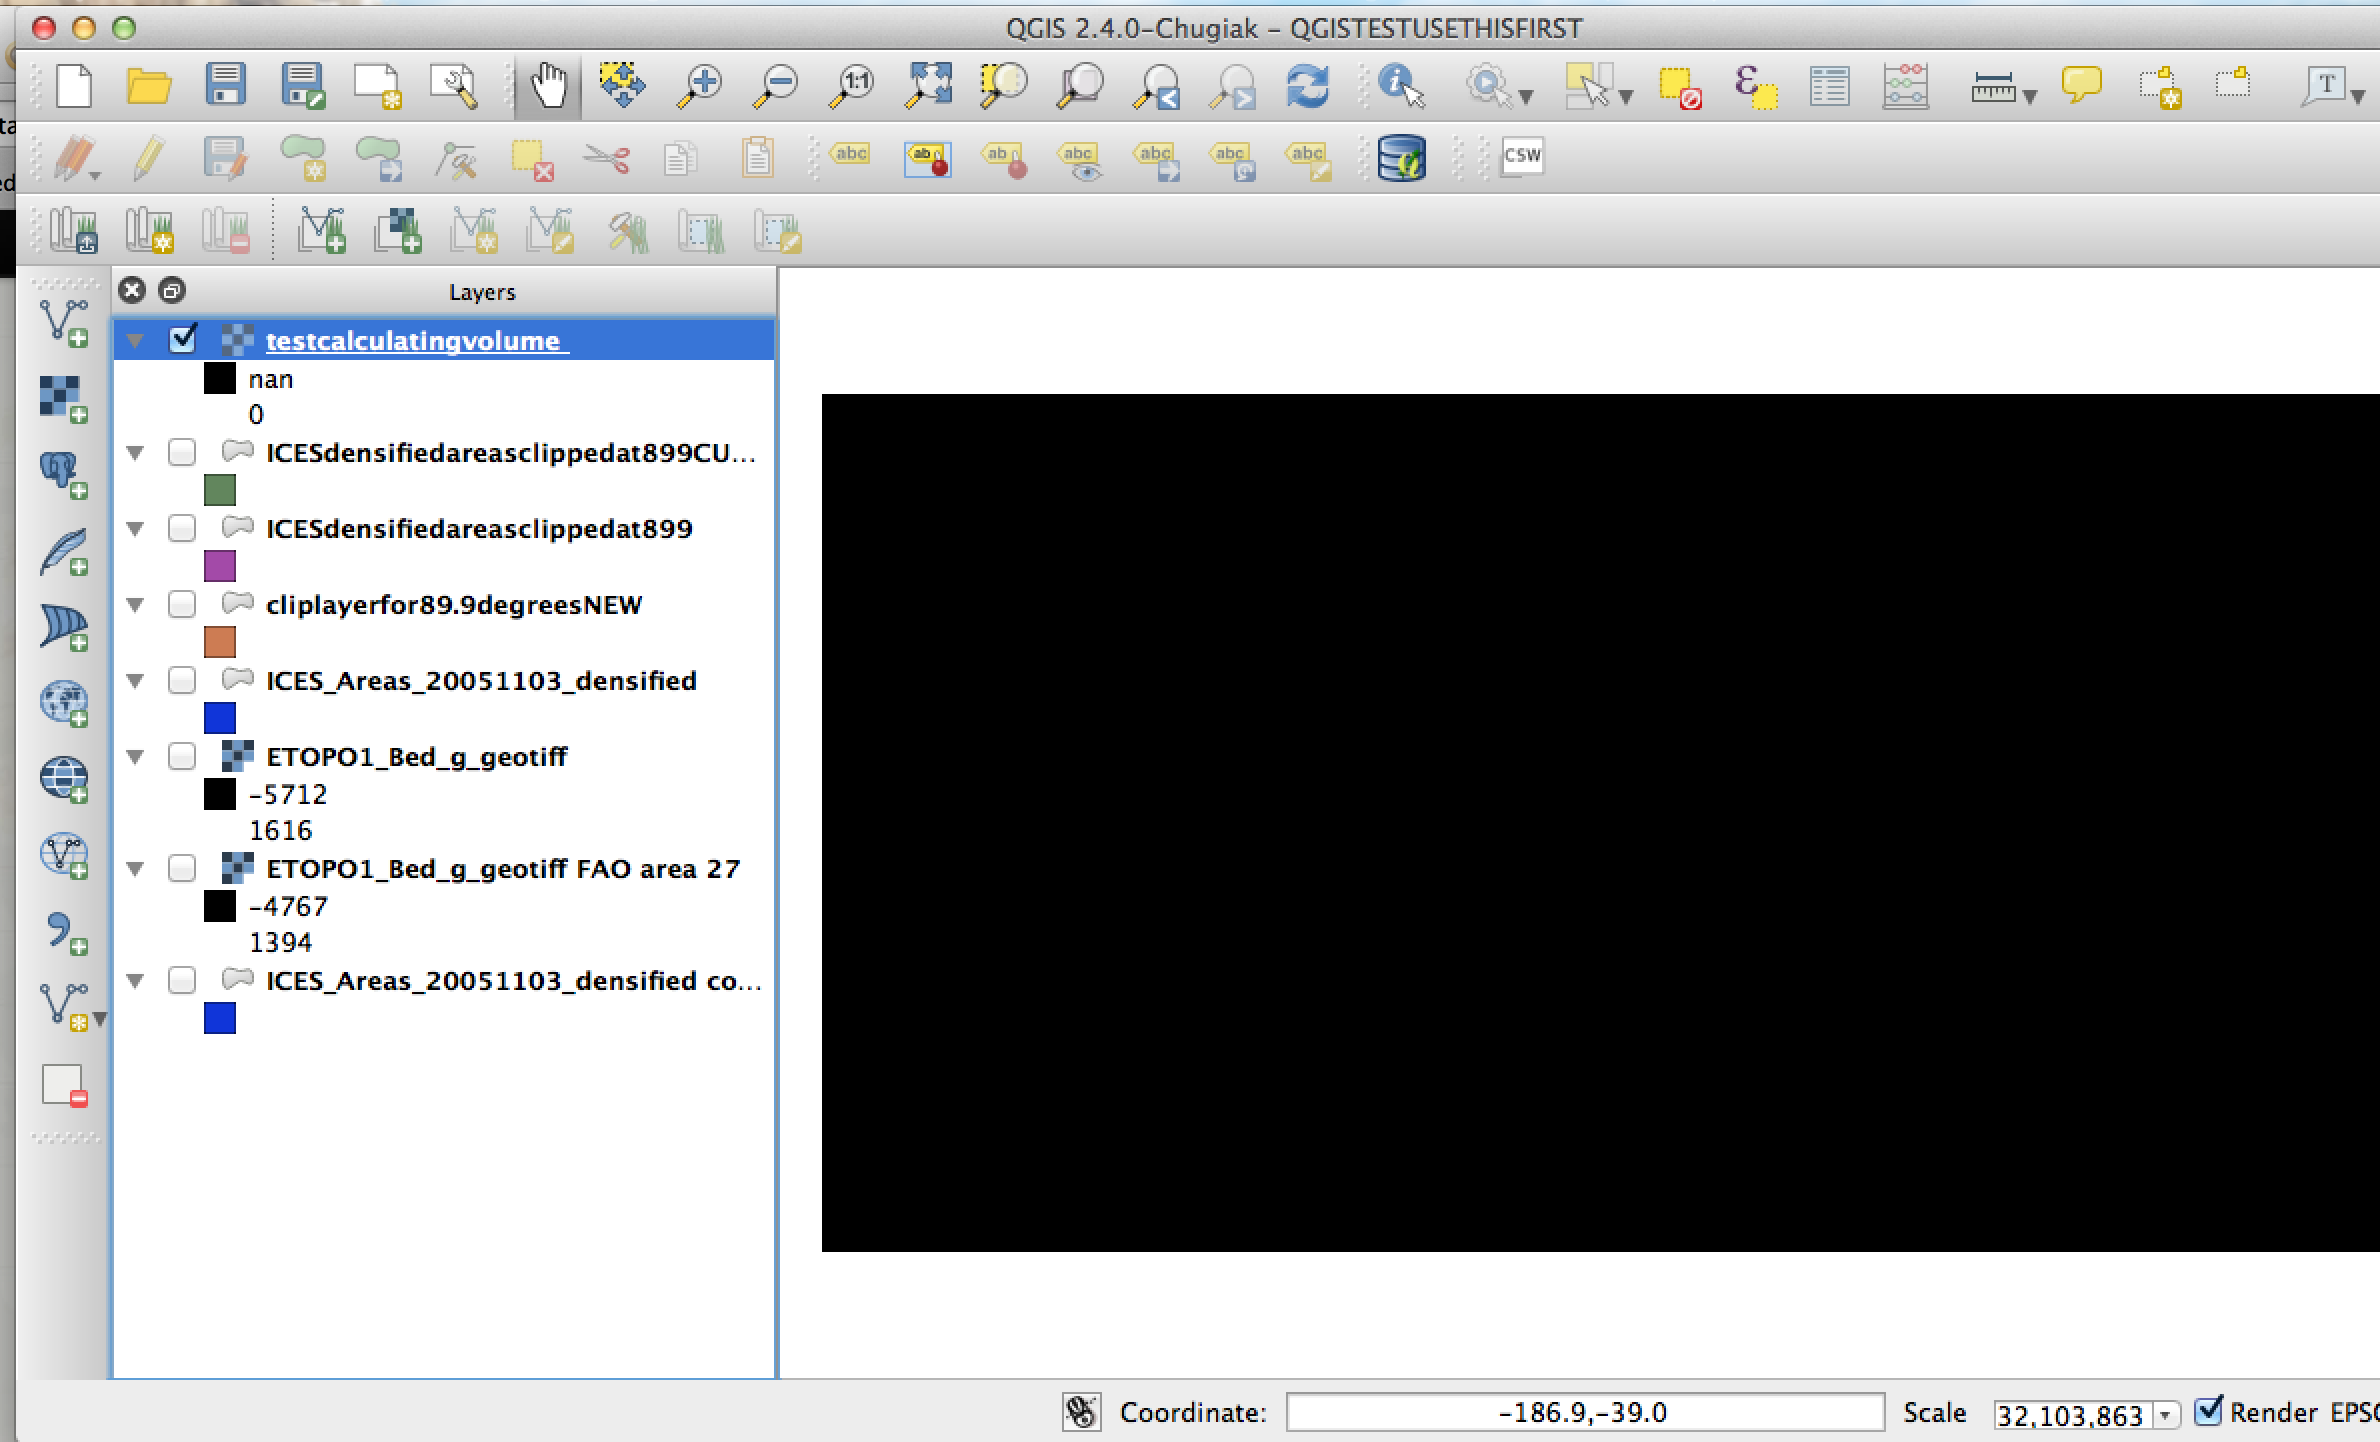
Please see following expression used. Please note this expression created a new raster which appears empty (2nd screenshot below).

"ETOPO1_Bed_g_geotiff@1(@z#actual_range>-200)(-200+50)+(@z#actual_range<=-200)(@z#actual_range>-50)*(@z#actual_range+50)"
enter image description here

enter image description here

2
  • Can you use PostGIS? Is a simple MapAlgebra operation using intersection and something like pixel_volume = pixel_area*pixel_value of bathymetric image. Commented Sep 27, 2014 at 22:48
  • Can you explain what is @z#actual_range? I'm not getting it? Commented Oct 4, 2014 at 7:46

3 Answers 3

4
+25

I believe you can use some map algebra (raster > raster calculator) before you can preform your volume measurements in grass.

Assuming that your bathymetric data use positive values to represent the sea depth, and using your example for the range as 50 the min_depth and 200 the max_depth. For each of the raster cells you need to "remove" anything below the 200 and above the 50. You have 3 possible situations:

  1. your cell depth is higher than the max_depth

    (@bathymetry > 200)

  2. your cell depth in the min_depth - max_depth range

    (@bathymetry <= 200) * (@bathymetry >= 50)

  3. your cell depth is lower that your min_depth

    (@bathymetry < 50)

In case 1 the size of the water column will be the entire size of our range:

(@bathymetry > 200.0) * (200.0 - 50.0)

In case 2 the "water column" is from your bathimetry depth until the minimum value of the range:

(@bathymetry <= 200.0) * (@bathymetry > 50.0)*(@bathymetry - 50.0)

In case 3 there is no useful "water column" for your specie therefore it would be:

(@bathymetry <= 50)*0.0

Since the 3 cases never occurs at the same time, all we need is to sum the expressions:

(@bathymetry > 200.0) * (200.0 - 50.0) + (@bathymetry <= 200.0) * (@bathymetry > 50.0)*(@bathymetry - 50.0) + (@bathymetry <= 50)*0.0

Since the last expression is always zero, the is no point in including it:

(@bathymetry > 200.0) * (200.0 - 50.0) + (@bathymetry <= 200.0) * (@bathymetry > 50.0)*(@bathymetry - 50.0)

And the generic version of the expression would be:

(@bathymetry > max_depth) * (max_depth - min_depth) + (@bathymetry <= max_depth) * (@bathymetry > min_depth)*(@bathymetry - min_depth)

After this, you can use the output raster in r.volume to sum all "water columns" values

8
  • Thanks. In my Raster file under properties --> metadata --> the following is stated: Pixel size: 0.00166667 - 0.0166667 . Is this what you are referring when you say cell depth? I have edited in (in the question), the entire data description found in my metadata for your reference. If you consider that z#actual_range (=-10898, 8271) goes from a minus extremity to a plus. I am assuming that the bathymetric information is in fact negative given that the deepest part of the ocean is said to be 10,994 its not far off. So in this case I would just place a minus in front of every bathymetric figure?
    – anina
    Commented Sep 28, 2014 at 9:00
  • No. When I'm referring to cell depth, I mean the sea depth (how many meters below the sea level). Also make sure that the -10898 value does not represent NO DATA instead of a really big sea depth. Commented Sep 28, 2014 at 15:14
  • so in case 1 do you mean: If in my study area (habitat area) I have areas where the ocean is deeper than the depth range of my fish stock. Case 2 do you mean: If in my study area the ocean is exactly between 50-200 meters deep (this is impossible as there will always exists a depth shallower than 50 meters in my data). And in case 3 do you mean: that if in my study area I have areas where the ocean depth is shallower than my fish stocks depth range?
    – anina
    Commented Sep 29, 2014 at 8:35
  • Additionally regarding your second comment, how do I check that?
    – anina
    Commented Sep 29, 2014 at 8:36
  • @anina, notice that map algebra is a cell by cell calculation. The cases I presented are for each one of your bathimetry raster cells. In the final expression each cell is tested for each case and a new value is set. Commented Sep 29, 2014 at 9:32
1

There's another GRASS module that you might find applicable to your case: v.rast.stats. This module creates a table of univariate statistics for each polygon in a vector layer, from the values in a raster. You will get: sum=the total of all cell values with each polygon, which is your habitat volume. And for free you also will have max, min, mean, std, etc.

So what Alexandre is suggesting, if I understand correctly, is to create 30 new bathymetric rasters, with specific min and max depths for each of the 30 fish species. For example, for the fish stock that lives only between 50-200 meters, you will have a new raster with NULL when the original bathymetry is <=50 or >=200, and the real bathymetric depth for all other cells between those depths.

Now, using the v.rast.stats module with each of the vector polygons for each fish stock, and the new matching bathemtric rasters you should be able to get your habitat volume.

BTW, using looping tools in a linux bash shell, or python, you could get all this to run in a batch. Assuming you have a CSV file with a list of the fish species and their min/max depths. It might go something like:

# First *set your region* of interest
g.region -p n=<...> s=<...> e=<...> w=<...> res=<...>
# Run the loop to create species specific bathy rasters
# I'm assuing you have the polygons in vector files named by the species
# You probably will have to tweak here
while read species, min, max; do \
    r.mapcalc "bathy_$species = if(bathymetry<=$max && bathymetry>=$min, bathymetry, null() ) \
    v.rast.stats vector=habitat_$species raster=bathy_$species colprefix=$species \
done << min_max_list.csv

HTH

1

I would use SAGA or python.

SAGA:

-import raster to grid

-reclassify all points greater than your min-depth to NODATA

-reclassify all points less than max-depth to NODATA

at this point you can visualize your band of habitat.

then you can do several different things but I would:

-create constant grid with value min-depth (not, max-depth is the deeper value)

-grid calculus: constant grid - your reclassified grid.

at this point, it's basically the same but all positive values with higher values being more deep.(essentially this raster is the thickness of your habitat band at any point) these two steps are not really needed..but it may help in figuring out what should be subtracted from what, etc.. Sometimes folks like positive numbers to work with.

-then, copied from: http://sourceforge.net/p/saga-gis/discussion/790705/thread/16b70fdf Geostatistics-Grids / Zonal Grid Statistics (simply create a "zone grid", i.e. a mask with unique identifiers (in your case a grid with the same value in all cells) and feed it together with your "grid to analyse" to the module. The resulting table contains a column with the sum of all grid cell values within each zone).

what that means is you need a grid that delineates different zones and the stats will be divided up per zone. you'll get a sum which you just multiply by your pixel area.

Python:

If you have python/numpy experience:

#let depth_raster be your original depth raster in numpy form
#note both min_depth and max_depth are negative

habitat_mask = (depth_raster < min_depth) & (depth_raster > max_depth)

habitat_points = depth_raster[habitat_mask]

habitat_thickness = - (habitat_points - min_depth)

habitat_volume = np.sum(habitat_thickness) * pixel_area

Your Answer

By clicking “Post Your Answer”, you agree to our terms of service and acknowledge you have read our privacy policy.

Not the answer you're looking for? Browse other questions tagged or ask your own question.