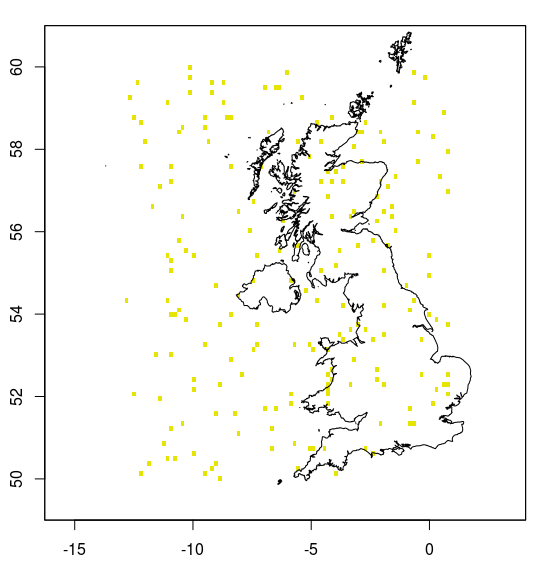
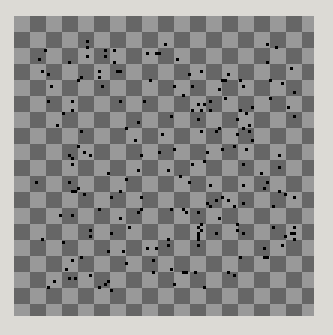
I have a huge CSV file of WGS84 latitudes and longitudes, and I would like to turn these into a large image file that I can print (with each point being a pixel on the image).
What is the best way to do this?
Currently I'm planning to convert them into eastings/northings and then use imagemagick to print a circle at each point, following the approach taken by this author (in the imagemagick script at the bottom of the post).
But I'm wondering if there's a simpler way. I'm not a GIS expert, and perhaps there's even a dedicated geospatial library for doing this?
UPDATE
As requested, here's a sample of the data. The points are all within the UK, but they don't form a regular grid.
Time,latitude,longitude
2014-12-27 18:35:10,51.7438644,-2.2094204
2014-12-27 18:34:08,51.7438657,-2.2094219
2014-12-27 18:33:06,51.7438657,-2.2094219
2014-12-27 18:32:04,51.7438689,-2.2094198
2014-12-27 18:31:03,51.7438716,-2.2094109
2014-12-27 18:30:01,51.7438537,-2.2094211
FURTHER UPDATE
To clarify, I'm looking for a large image that I can print. The points aren't on a regular grid: I was hoping that I could turn each point into a single black pixel on a transparent background.


