4

I am using QGIS 2.6 on Windows 7.

I have generated two rasters from vector layers. They cover the same extent and have the same projection (Irish Transverse Mercator) and cell size (5m x 5m). I have 'reclassified grid values' to ensure that both rasters now have values of only 0 or 10. I have been attempting to add the rasters together in the raster calculator ("NPWS@1"+"CH_Extract@1") and I am expecting to see values of 0, 10 or 20 (where there is overlap between the two original vector datasets). Instead I get an output layer with values of 0 or 9.989990. I have tried every permutation I can think of to fix this and am having no joy.

2
  • Have you set the output extent and resolution appropriately? Commented Mar 26, 2015 at 18:00
  • I believe so, I have used the same projection, extent and resolution when I have saved the final rasters as a GTiffs, which I have then added to QGIS for the calculation.
    – ImpactGIS
    Commented Mar 26, 2015 at 18:08

2 Answers 2

3

The problem is that your individual rasters are not aligned. So, when they are added the result is a weighted average for the values in the overlaping area. To solve this you have to use a merged vector layer whose extension must be used for producing individual raster. I used this procedure for testing it:

1) I created two vector layers (both with the same value field = 10) where they are overlaped in some area:

enter image description here

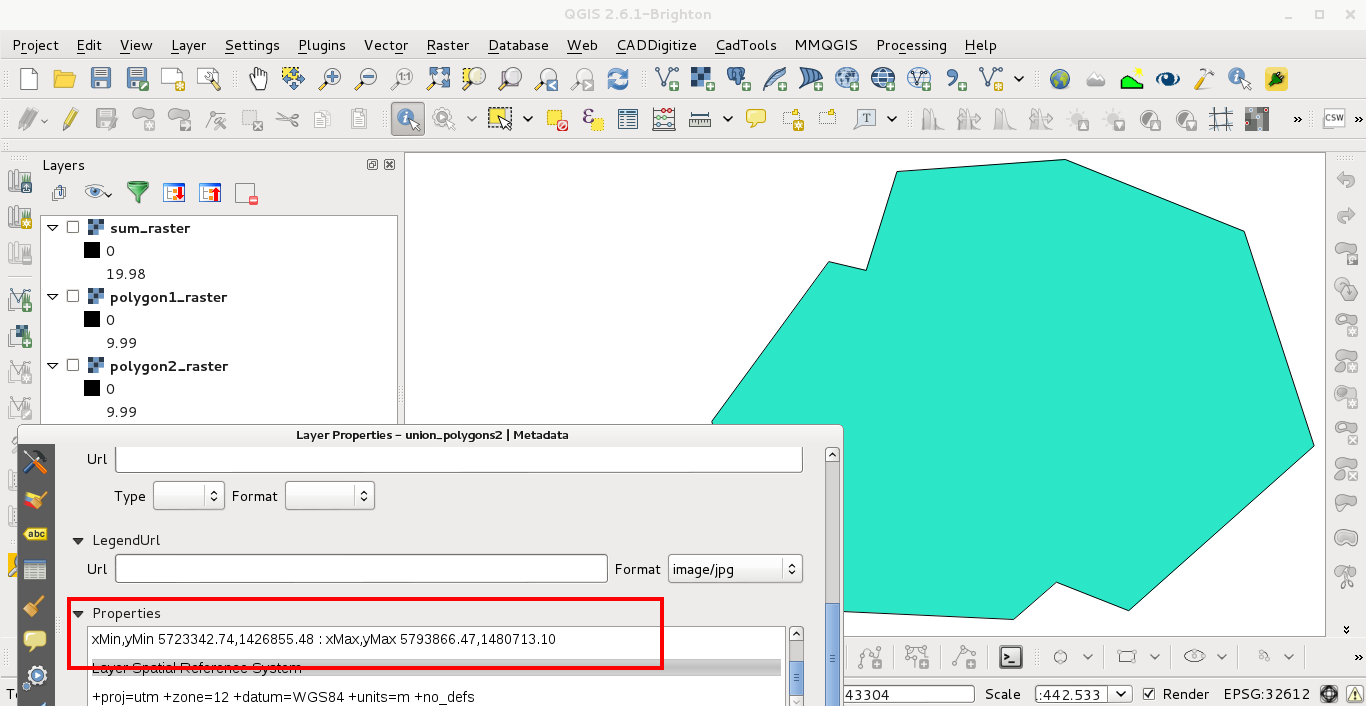
2) I merged them and I wrote down its extension:

enter image description here

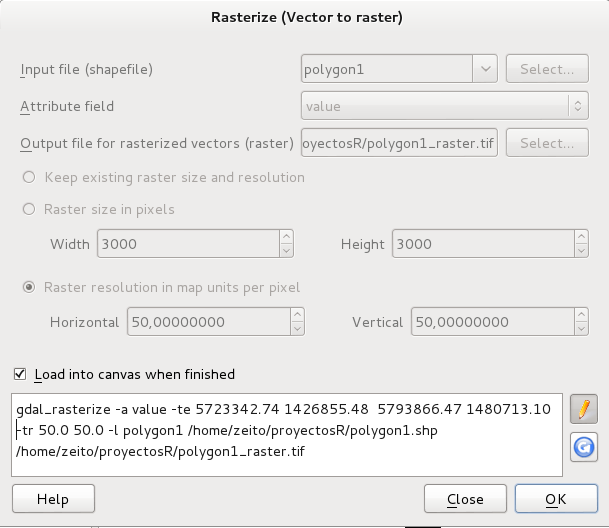
3) Using the extension to rasterize (by value field = 10) the first vector layer:

enter image description here

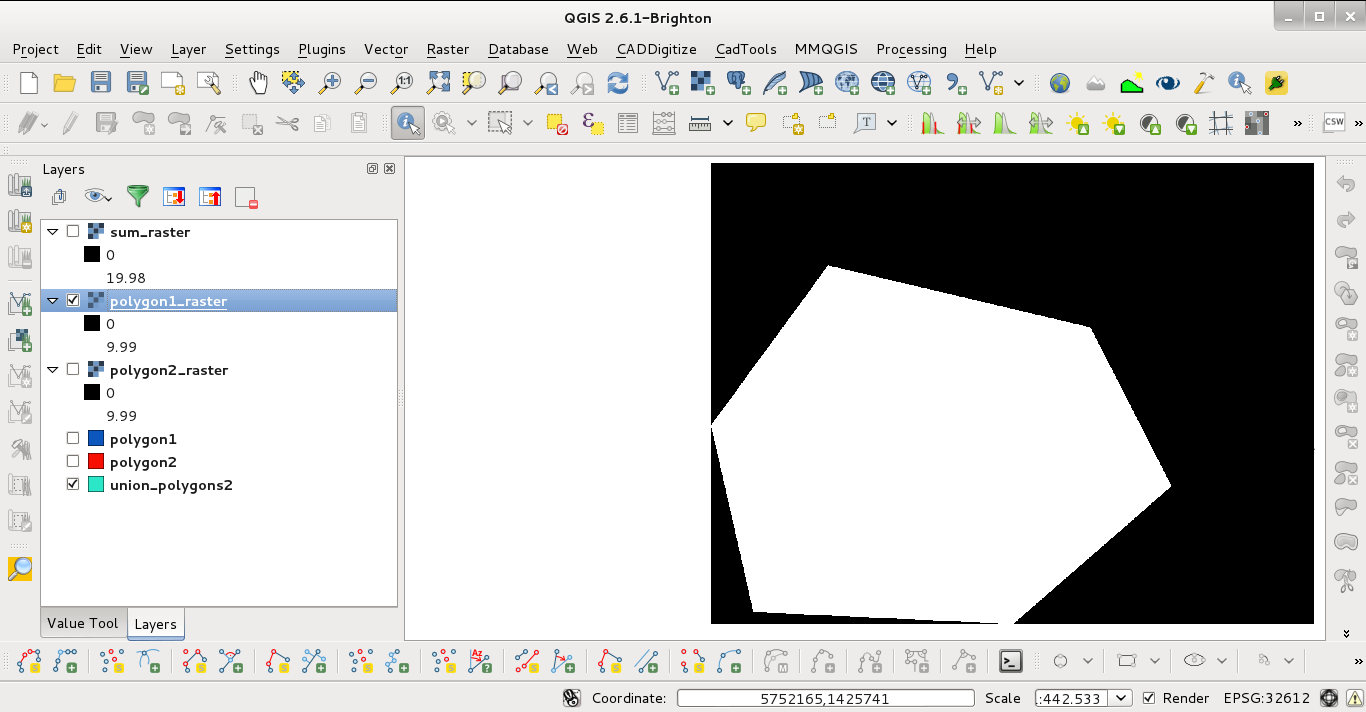
4) First vector layer rasterized:

enter image description here

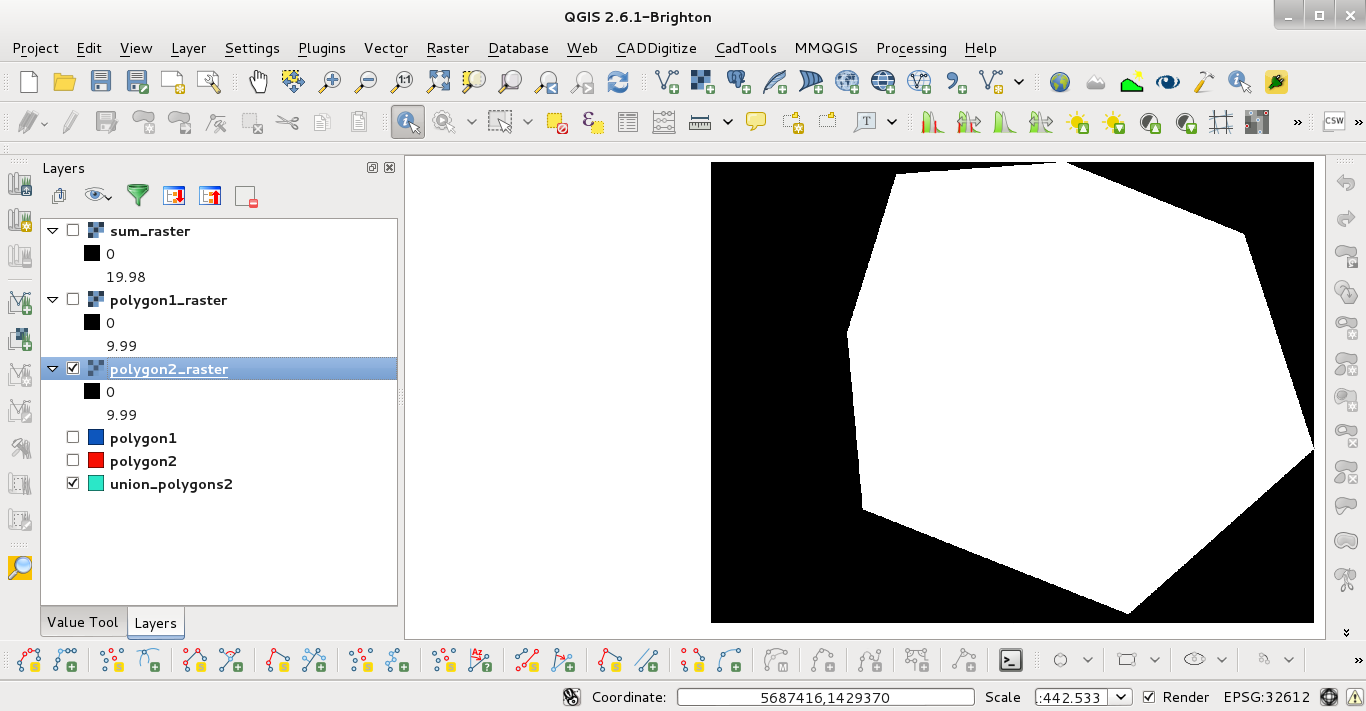
5) Second vector layer rasterized:

enter image description here

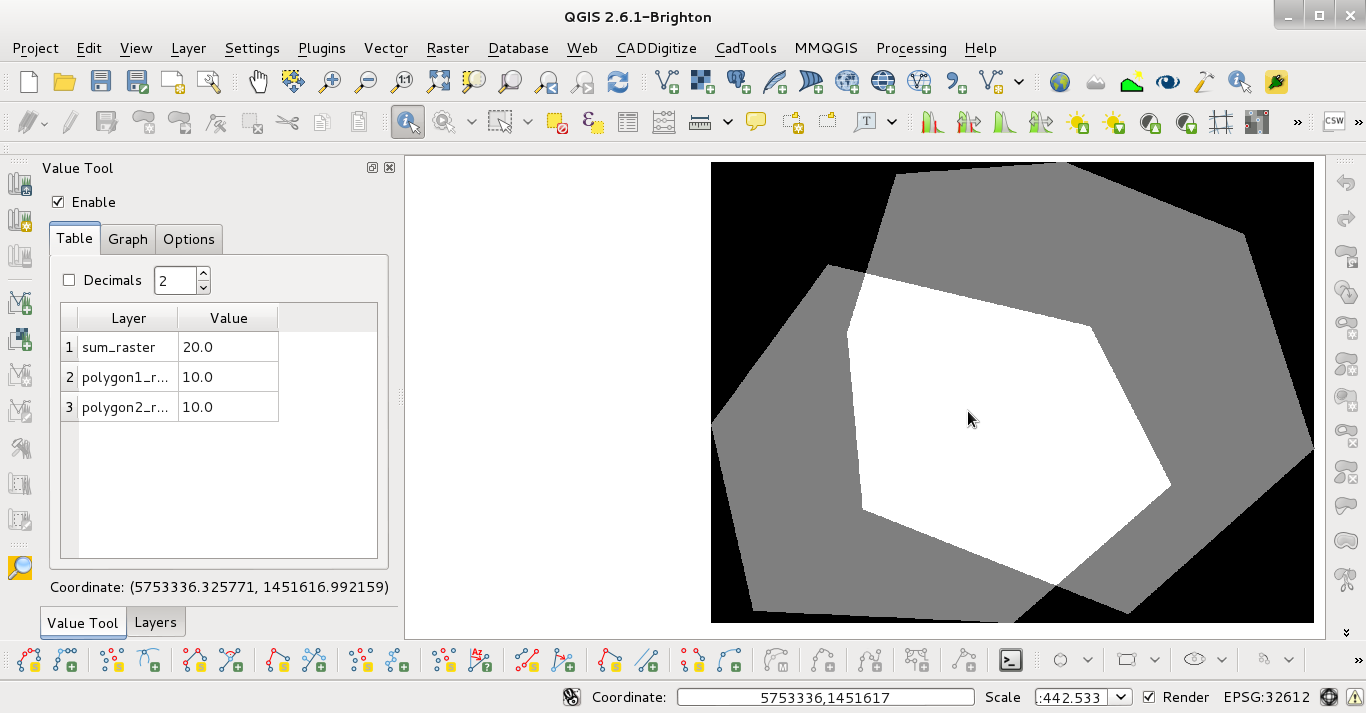
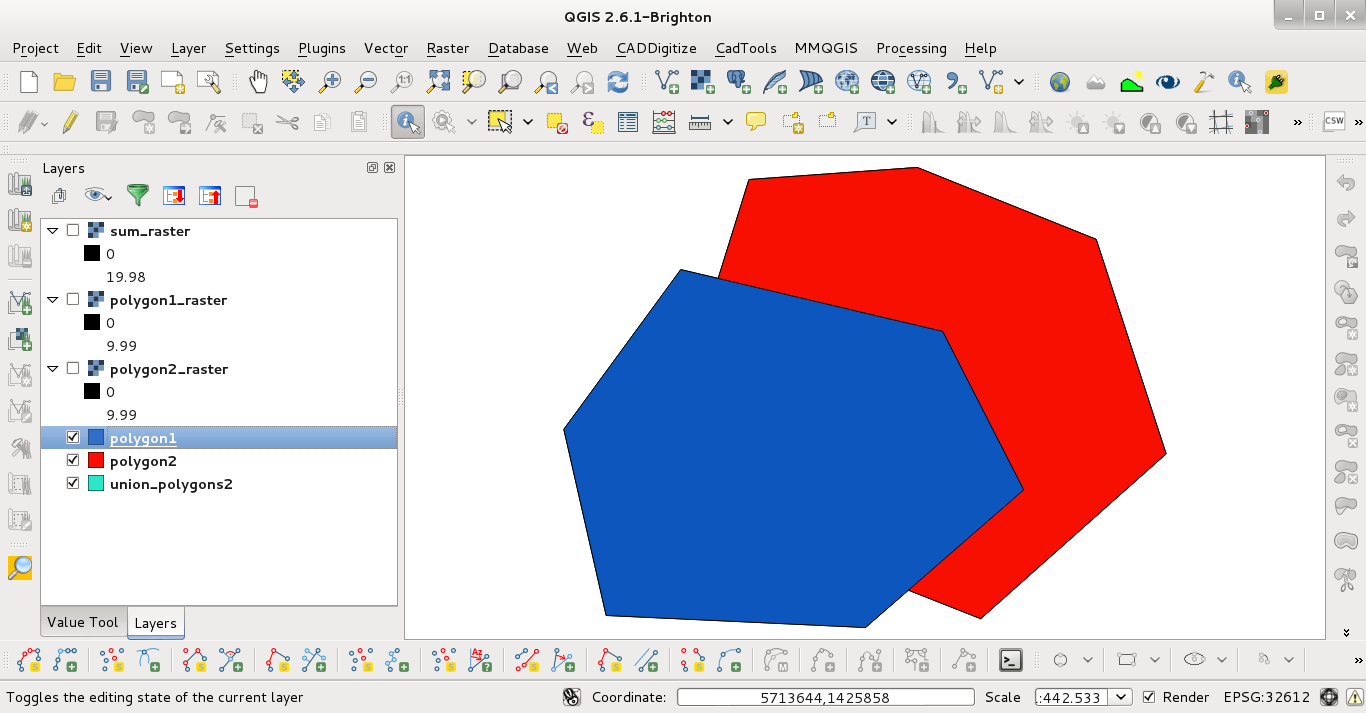
6) sum_raster obtained by using raster calculator. You can observe that the sum is 20 in overlaped areas (Value Tool plugin). The values: 0 (black area), 10 (gray area), 20 (white area).

enter image description here

0
1

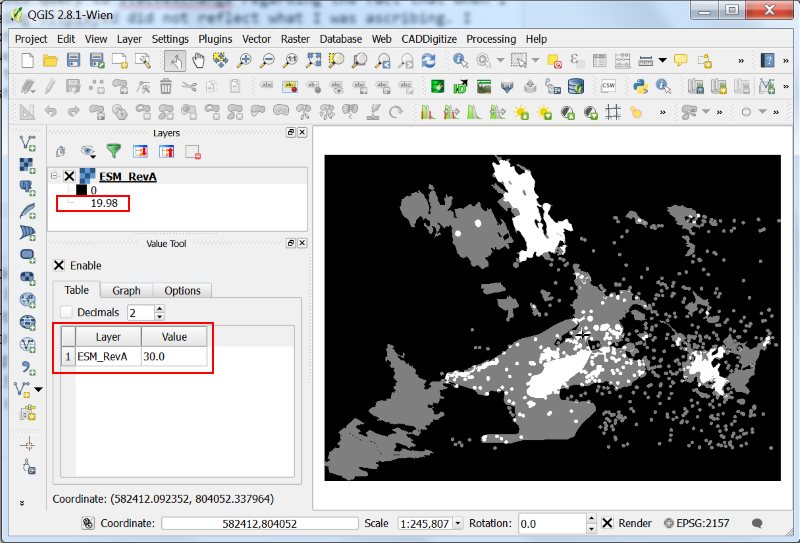
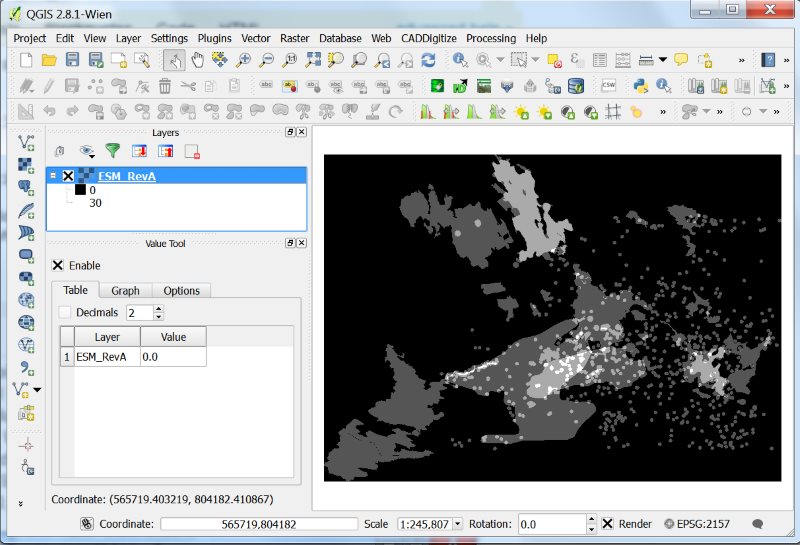
@xunilk pointed me towards the 'Value Tool' plugin which has allowed me to track down where things were going wrong. I had posted a previous query to stackexchange regarding the fact that when I was creating rasters the values being displayed did not reflect what I was ascribing. I noted the same with you screen captures above. When a value of 10 has been ascribe QGIS displays the raster as having values from 0 to 9.99. When I added two rasters together I got max values of 19.98. When I added three I was still getting max values of 19.98 yet when I passed the Value Tool over the raster it was telling me that there were areas of value 0, 10, 20 and 30, as indicated in the image below.

Scree capture of QGIS showing raster with 'Max' value indicated as 19.98 but with actual values of up to 30 in the 'Value Tool' window

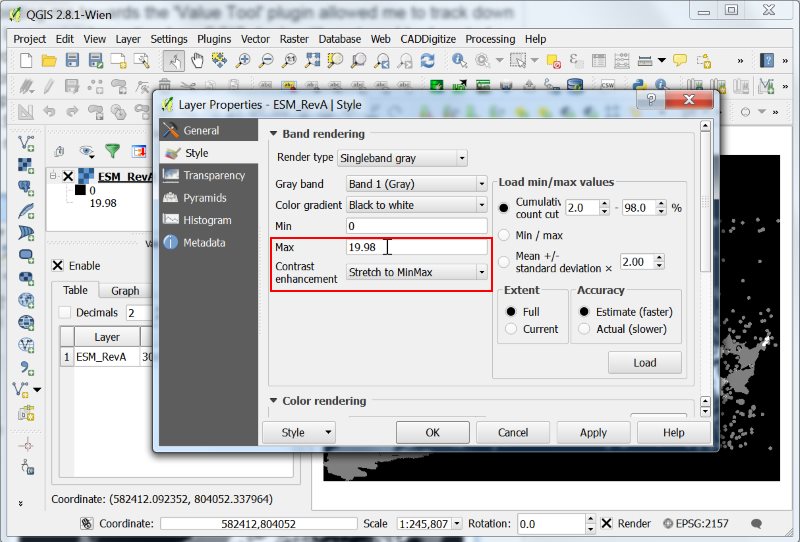
Going into the properties dialogue and 'Stretch(ing) to MinMax' does not affect this.

Screen capture of QGIS showing 'Properties' dialogue 'Style' tab with raster max / min values

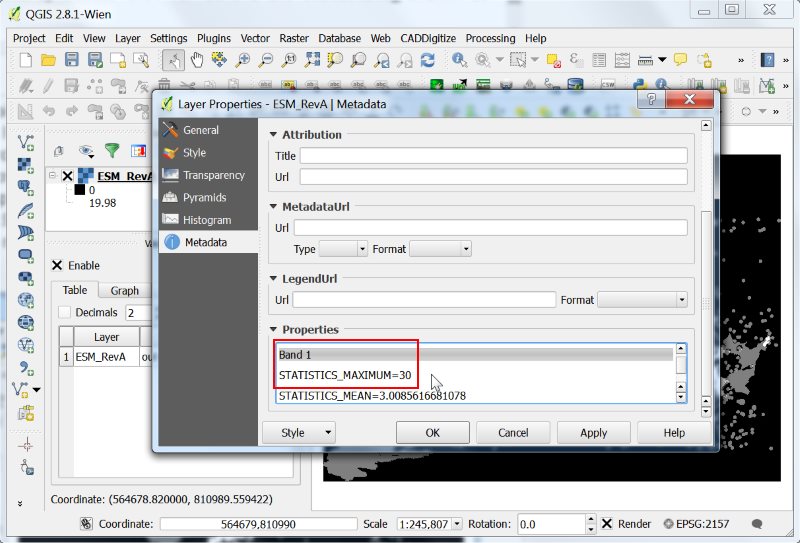
Even though the raster meta data clearly states that for Band 1 the Statistics_Maximum is 30.

Raster meta data showing Statistics_Maximum for raster band 1

With this knowledge I have overridden the the 'Max' value for 'Band Rendering' and everything now looks good.

Screen capture of QGIS with raster max value overridden to display actual max of 30

1
  • You're welcome. I would appreciate if you mark the question as answered. Thanks!
    – xunilk
    Commented Mar 31, 2015 at 14:56

Your Answer

By clicking “Post Your Answer”, you agree to our terms of service and acknowledge you have read our privacy policy.

Not the answer you're looking for? Browse other questions tagged or ask your own question.