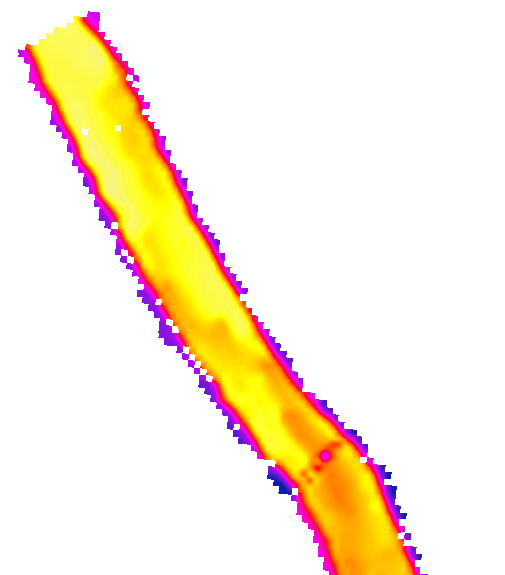
I highly recommend you do not do this as you will be removing important pieces of data. The pixelated visual effect is appropriate because a raster is a set of pixels with varying information.
In life, data is often not "pretty" and since this is for a school report, I recommend not to adjust the data just for appearance.
However, in order to remove a certain value visually, you can go into the symbology and add a specific value (whatever the purple is) and set it to no color or to white.
In order to remove the value all together, select pixels that have the value you wish to remove and delete or change to 0.
You can also apply a mask to the entire data frame using a vector layer: Go to your data frame properties, click the data frame tab, clip to a specific layer. This action does not actually change the data, but masks the frame (what you see) to a specific extent, layer, etc. You can also choose to exclude certain layers.

