I'm trying to make a cluster visualization of a vector point layer about trees with a few requirements:
- The clusters need to change depending on zoom level (solved)
- The clusters need to indicate how many vector objects are clustered (solved)
- The clusters need to have labels that describe the objects that are clustered
- This needs to be done with styling, so that the CRS can be copypasted (the data table will be updated and the clustering needs to be automatic)
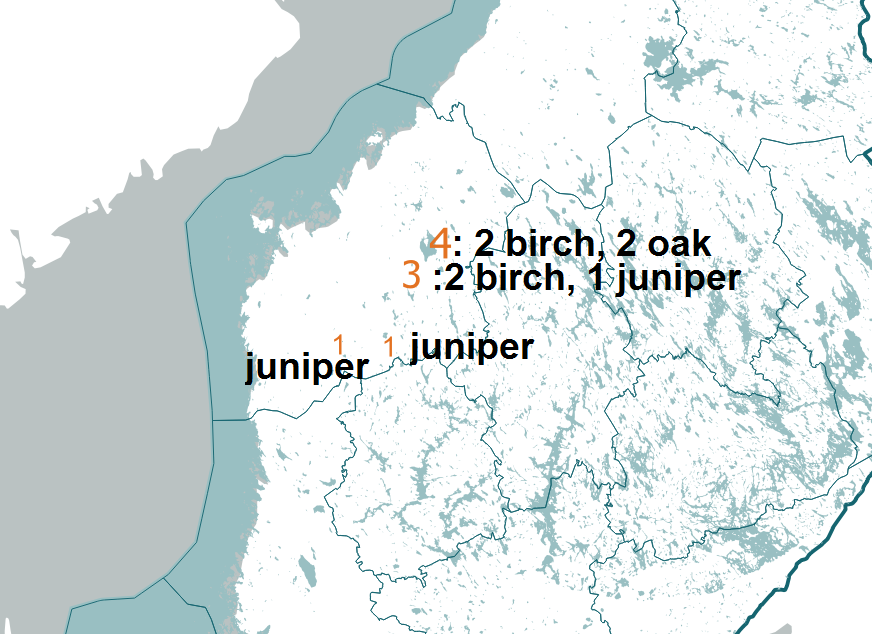
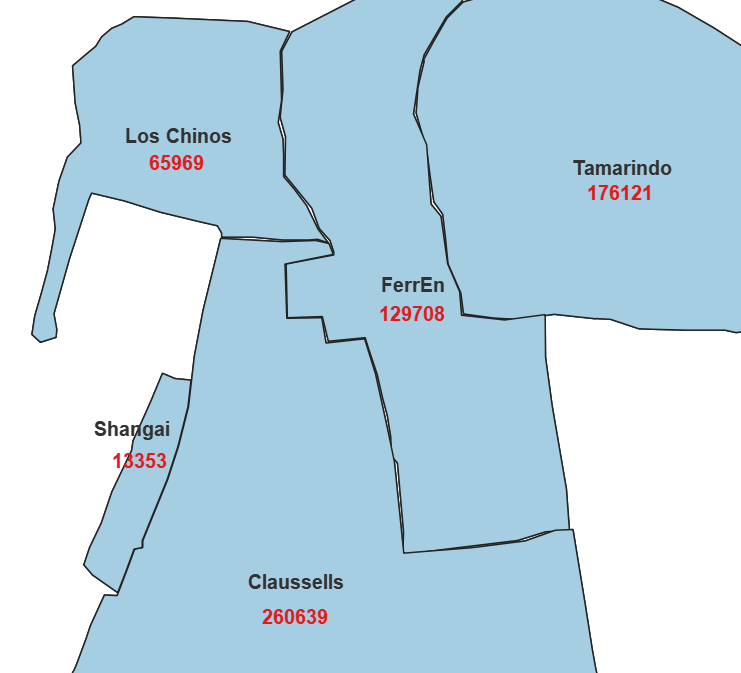
I would like to show something like this in the final product (I inserted the black text by hand in MS Paint for reference):
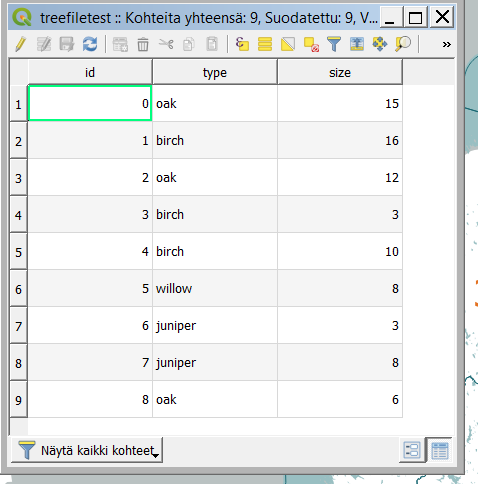
The data for the trees:
The Point Cluster is only a visualization, so automatic labeling will create labels to individual objects, not to each cluster. Also, the @cluster-functions are only available inside the Cluster Point styling context. This is why I would like to make another layer with Cluster Points styling, which has a Font Marker as the cluster symbol. The text for the symbol would need to have conditional formatting. I would do it in SQL with something like this:
select count(*), "type"
from @cluster
group by "type";
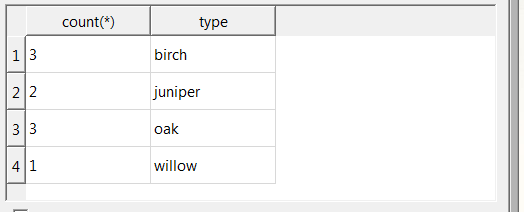
Which would yield something like this:
This would show the text in the way I need it on each different zoom level. However, I can't find a way to get a grip of the objects inside each cluster. The @cluster does not actually work.
How do I make grouped text clusters with Cluster Point styling, and how do I get a hold of the objects inside clusters?


@cluster_sizeand@cluster_color. I don't know any way to label features based on whether they're in a cluster. But maybe someone else will think of a creative workaround.