4

I'm quite new to GIS (so please be patient with my incorrect terminology) but I'm teaching myself as much as I can in order to create my own map of the Boundary Waters Canoe Area in northern Minnesota. My goal is to keep the resolution high enough to be able have it printed when I'm done on a 10' x 5' banner for a wall in my basement. I've been collecting all of the feature data I will need for the various layers I'd like to add, camp sites, trails, lake depth contours, historical forest fire data, etc.

I'm using QGIS on OSX, and have successfully created the map with all of the different layers, but the map services I've found do not have high enough resolution - I believe I will ultimately need ~300 DPI. So I turned to the USGS topos to create my own base map.

For my base map, I've downloaded ~65 USGS 7.5 minute topo quads. I've successfully used GDAL and converted all of my GeoPDFs to GeoTIFFs in order for me to be able to use them in QGIS, dropping all of the layers I do not want. Next, I need to tile them together, which seems like it should be easy... but...

But now I'm stuck because of the collars, those dang collars!

I've been exploring two different paths.

  1. Clipping / cropping / trimming the collars off of my TIFFs. The only progress I've made here is using a 7.5 minute grid, creating a shapefile from each individual cell, then extracting each map file to the corresponding mask layer. Painful, and not perfect. I have small black spaces at each image intersection where the images overlap. This overlap issue leads to my second path:

  2. Using the current TIFF files with overlap but somehow merging them but always honoring the image that is not blank

Things I've explored:

  • SAGA mosaic doesn't work as my TIFF files have multiple bands
  • I haven't been able to figure out how to use nearblack, but at one point it seemed promising
  • gdal warp seems like it might be an option but I haven't been able to figure it out.

I'm open to anything at this point, as I'm quite stuck.

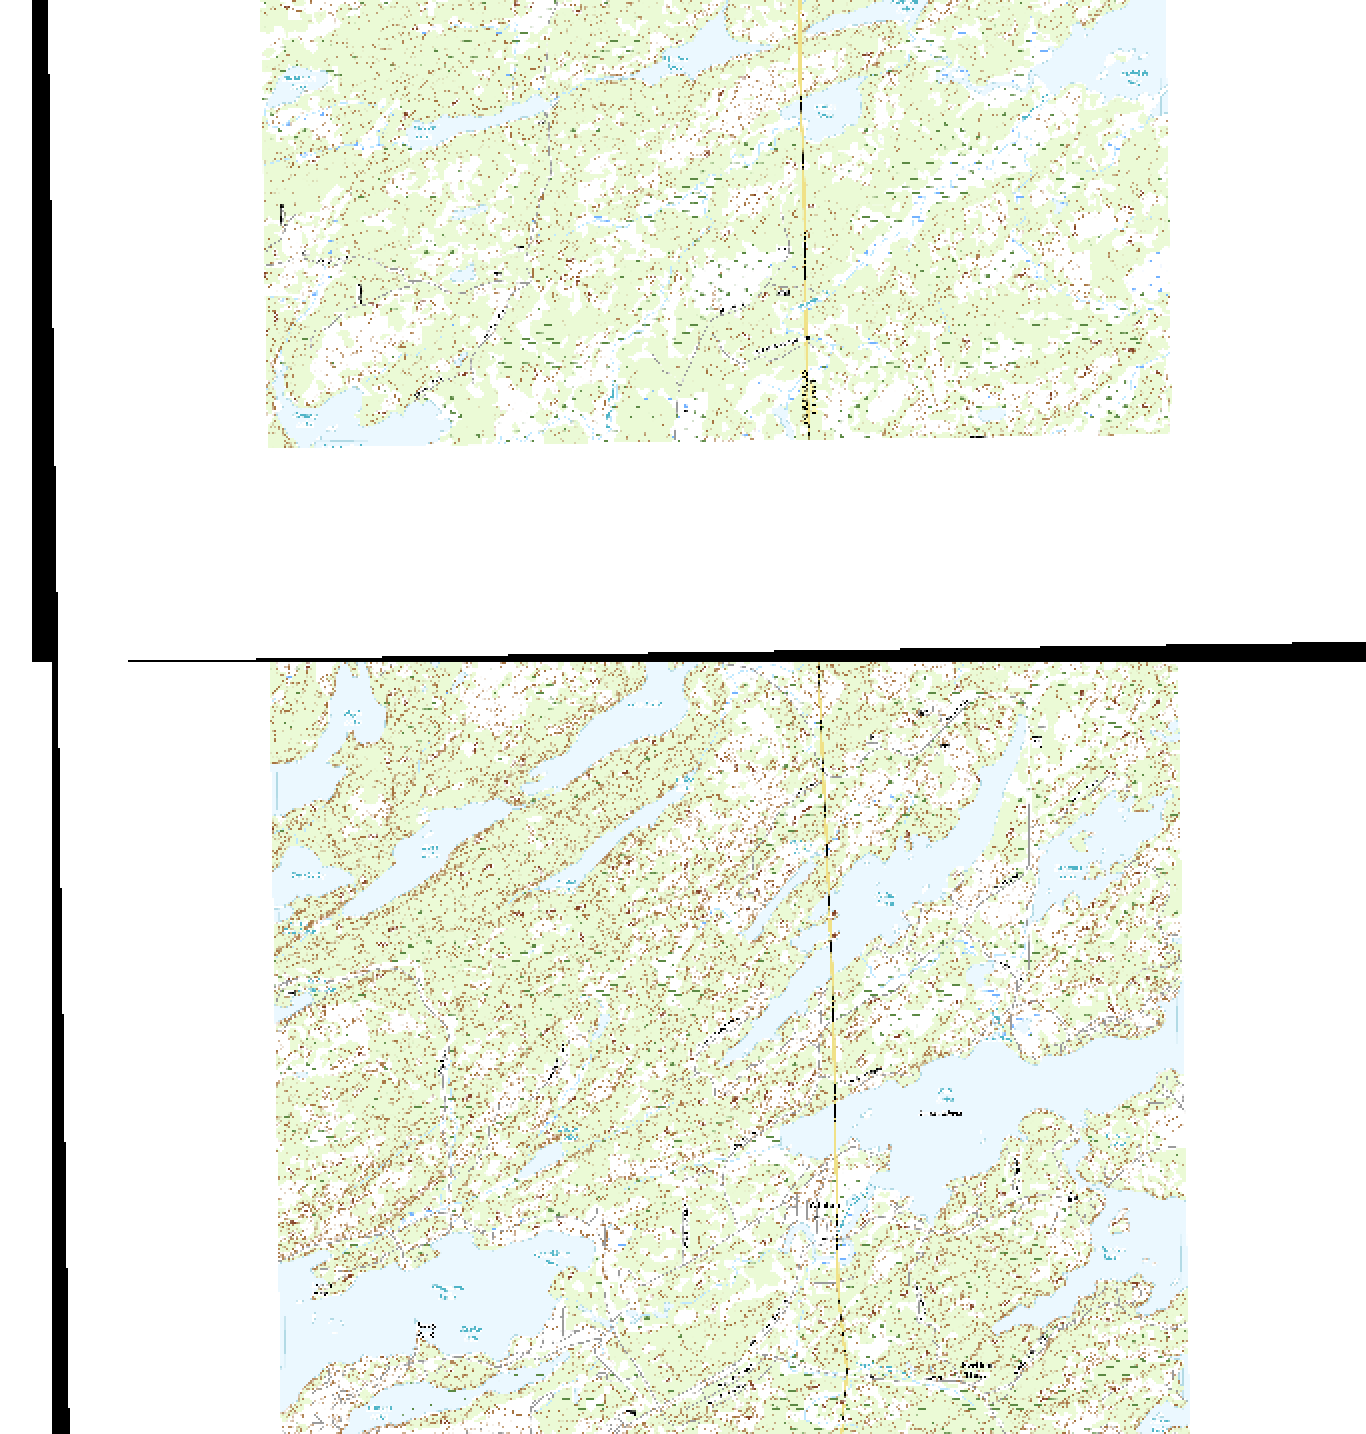
Below is just a sample of an overlap where the white collar of the upper image is covering up a portion of the map on the lower image.

Let me know what other details are needed.

example of collars covering up at overlaps

In case it helps - here is gdalinfo for one of my images:

Files: O-MN_Lake_Agnes_20160511_TM_geo.tif. 

Size is 6825, 8700 . 

Coordinate System is:  

PROJCS["NAD83 / UTM zone 15N",  
    GEOGCS["NAD83",  
        DATUM["North_American_Datum_1983",  
            SPHEROID["GRS 1980",6378137,298.257222101,  
                AUTHORITY["EPSG","7019"]],  
            TOWGS84[0,0,0,0,0,0,0],  
            AUTHORITY["EPSG","6269"]],  
        PRIMEM["Greenwich",0,  
            AUTHORITY["EPSG","8901"]],   
        UNIT["degree",0.0174532925199433,  
            AUTHORITY["EPSG","9122"]],  
        AUTHORITY["EPSG","4269"]],  
    PROJECTION["Transverse_Mercator"],  
    PARAMETER["latitude_of_origin",0],  
    PARAMETER["central_meridian",-93],  
    PARAMETER["scale_factor",0.9996],  
    PARAMETER["false_easting",500000],  
    PARAMETER["false_northing",0],  
    UNIT["metre",1,  
        AUTHORITY["EPSG","9001"]],  
    AXIS["Easting",EAST],  
    AXIS["Northing",NORTH],  
    AUTHORITY["EPSG","26915"]] . 
GeoTransform = . 
  562647.9383617276, 2.031842193813695, 0.02475724967923335 . 
  5345953.334329214, 0.02475724967923335, -2.031842193813695 . 
Metadata:  
  AREA_OR_POINT=Area . 
  AUTHOR=USGS National Geospatial Technical Operations Center . 
  CREATION_DATE=D:20160511071429Z . 
  CREATOR=ESRI ArcSOC 10.0.2.3200 . 
  KEYWORDS=Topographic, Transportation, Hydrography, Orthoimage, U.S. National Grid, imageryBaseMapsEarthCover, Imagery and Base Maps, Geographic Names Information System

  NEATLINE=POLYGON ((574476.409995194 5330616.81030751,565063.890498903 5330502.12222002,564893.116537944 5344517.64268281,574305.636034233 5344632.3307703,574476.409995194 5330616.81030751)) . 

  SUBJECT=This image map depicts geographic features on the surface of the earth.  It was created to provide a representation of accessible geospatial data which is readily available to enhance the capability of Federal, State, and local emergency responders for homeland security efforts.  This image map is generated from selected National Map data holdings and other cartographic data.

  TITLE=USGS 7.5-minute image map for Lake Agnes, Minnesota
Image Structure Metadata:

  INTERLEAVE=PIXEL . 

Corner Coordinates:  
Upper Left  (  562647.938, 5345953.334) ( 92d 9'21.06"W, 48d15'49.28"N)

Lower Left  (  562863.326, 5328276.307) ( 92d 9'20.03"W, 48d 6'16.73"N)

Upper Right (  576515.261, 5346122.303) ( 91d58' 8.38"W, 48d15'49.27"N)

Lower Right (  576730.649, 5328445.275) ( 91d58' 9.43"W, 48d 6'16.73"N)

Center      (  569689.294, 5337199.305) ( 92d 3'44.73"W, 48d11' 3.14"N) 

Band 1 Block=6825x1 Type=Byte, ColorInterp=Red
Band 2 Block=6825x1 Type=Byte, ColorInterp=Green
Band 3 Block=6825x1 Type=Byte, ColorInterp=Blue
6
  • Basically, you could use gdalwarp -crop_to_cutline and gdalbuildvrt using virtual files to get a seemless layer. Be sure to work in the source projection to avoid artefacts along the edges. Once you did it successfully with some files in QGIS, do the rest on the command line.
    – AndreJ
    Commented Sep 23, 2018 at 7:33
  • Thanks for the quick response. Ive been playing around with the crop_to_cutline but I havent been able to figure it out. How do I define my cutline? with a referenced shapfile? Could you provide an example so I can better understand the syntax of this gdal function?
    – Jerod
    Commented Sep 23, 2018 at 14:08
  • I have not tested it myself, but ogrinfo reports several vector layers inside the PDF. If you extract those with ogr2ogr, do you have the data you need?
    – AndreJ
    Commented Sep 23, 2018 at 16:31
  • For the cutline, see gis.stackexchange.com/search?q=gdalwarp+pdf+cutline
    – AndreJ
    Commented Sep 23, 2018 at 17:26
  • ... and my examples at gis.stackexchange.com/questions/74980/… and gis.stackexchange.com/questions/103201/…
    – AndreJ
    Commented Sep 23, 2018 at 18:02

5 Answers 5

3

Rather than using individual US Topo quadrangles (which are designed to be displayed in that format), you can download the underlying vector data from The National Map and customize the extent of your display. (There is also a style sheet available to match the symbology of US Topo maps, although this is an ArcGIS-specific format and I don't know whether it can be converted to use in QGIS.)

3
  • Thanks! I downloaded a few to test them out and have been unable to import them into QGIS successfully. Ill try a few more things and keep poking around.
    – Jerod
    Commented Sep 23, 2018 at 20:38
  • What trouble are you having with the import?
    – Nathan
    Commented Sep 24, 2018 at 4:46
  • I was getting an error about it not being a valid layer, it didnt like the format. This was in QGIS 2.18. I just now attempted to add them into QGIS 3.2 and was successful. This seems like it could be my best option to retain max resolution. Thanks for the info!
    – Jerod
    Commented Sep 24, 2018 at 11:47
2

My best advice is to follow the instructions provided by the GDAL devs at https://trac.osgeo.org/gdal/wiki/USGS_PDF_Topo

It contains a python script to extract the neatline from the PDF metadata.

Unfortuantely, the neatline is too large, it includes the grid coordinates. So you can do this:

  1. run python config.py yourfile.pdf inside the OSGEO4W shell
  2. load the tif file into QGIS
  3. add the cutline.csv as Delimited text selecting EPSG:26915 as CRS
  4. Save the CSV as shapefile
  5. change the polygon styling from solid to no brush
  6. adjust the corner coordinates to match the map extent
  7. Save the shapefile
  8. return to the OSGEO4W shell and run

gdalwarp MN_Lake_Agnes_20160511_TM_geo.pdf Lake_Agnes.tif --config GDAL_PDF_LAYERS "ALL" --config GDAL_PDF_LAYERS_OFF "Images" --config GDAL_PDF_DPI 300 --config GDAL_PDF_BANDS 4 -crop_to_cutline -cutline cutline.shp -overwrite

If you want, you can snap the shapefile corners of the topo maps to get a real seemless result.

1
  • Awesome! thanks for digging that up. Ill give it a shot.
    – Jerod
    Commented Sep 25, 2018 at 16:20
1

For those finding this via search, note the NEATLINE (as obtained from gdalinfo) in many (all?) USGS quad PDFs are currently incorrect, being larger than the correct NEATLINE (as of 2020). So solutions based on NEATLINE, as some of the above are, will not work (until they hopefully get them corrected).

The solution is to recognize that USGS quad corners are at set intervals of 1/8 degree. That info can't be obtained from gdalinfo and seems to be semi-lost information by those depending on such tools. Once you figure out the corner lat,lon values, you can extract/reproject the image.

0

You can do this in a couple of steps using:

  • Quad corner data
  • gdalwarp - to convert/clip the GeoPDF

Obtain quad corners

While extracting the neatline from the map is probably ideal, but it possible to get the quad corners from elsewhere.

USGS Quad corners can be downloaded either from the Map Indices server (https://carto.nationalmap.gov/arcgis/rest/services/map_indices/MapServer) or in Shapefile or GDB format (on a per state basis) from https://www.sciencebase.gov/catalog/item/53d7cd8ee4b06f0f87b7427b

If you are using the server, you can clip the data to your area of interest.

I tend to save the data to a GeoJSON file because it's easily readable in a text editor, but you can use any geo-file format (eg for the Shapefile or GDB downloads you probably don't need to convert it at all). You can then use it as the cutline in the next step.

Convert the GeoPDF

In the OSGEO4W shell run something like the following (using the 2017 version of the Calico Peak (UT) map). The key is the cwhere option:

gdalwarp -t_srs EPSG:26912 -r cubic -cutline "C:\path\to\map_boundaries.geojson" -cwhere "CELL_NAME = 'Calico Peak'" -crop_to_cutline -dstalpha -co "COMPRESS=LZW" --config GDAL_PDF_LAYERS_OFF "Map_Collar","Map_Frame.Projection_and_Grids","Map_Frame.PLSS","Images" --config GDAL_PDF_DPI 300 "C:\path\to\UT_Calico_Peak_20170216_TM_geo.pdf" "C:\path\to\UT_Calico_Peak_20170216_TM_geo.tif"

My preference is to remove the grid from the map and add my own in QGIS if necessary, hence the various layers removed via the GDAL_PDF_LAYERS_OFF config option.

There are various settings you can play with (the compression, the rescaling option, the target SRS etc).

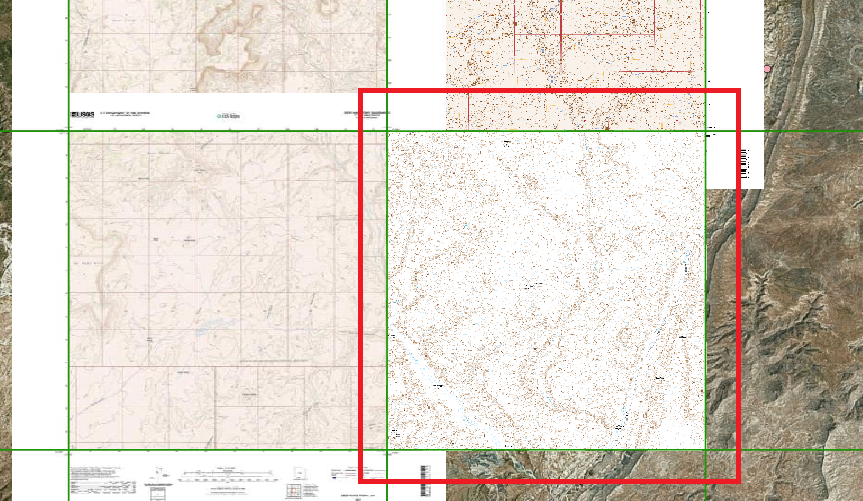
The result is a nicely clipped quad, in contrast to the surrounding maps which haven't been clipped:

enter image description here

For processing large numbers of maps, it should not be too hard to connect the CELL_NAME to the map names - but probably needs a bit of wizardry with Regex. I gave up and added a new field which had the spaces in the names replaced with underscores - this is easily done in QGIS!

-1

Have a look at MAPC2MAPC which will - among many other things - remove collars and crop and merge maps together seamlessly. It preserves the calibration and projection.

3

Your Answer

By clicking “Post Your Answer”, you agree to our terms of service and acknowledge you have read our privacy policy.

Not the answer you're looking for? Browse other questions tagged or ask your own question.