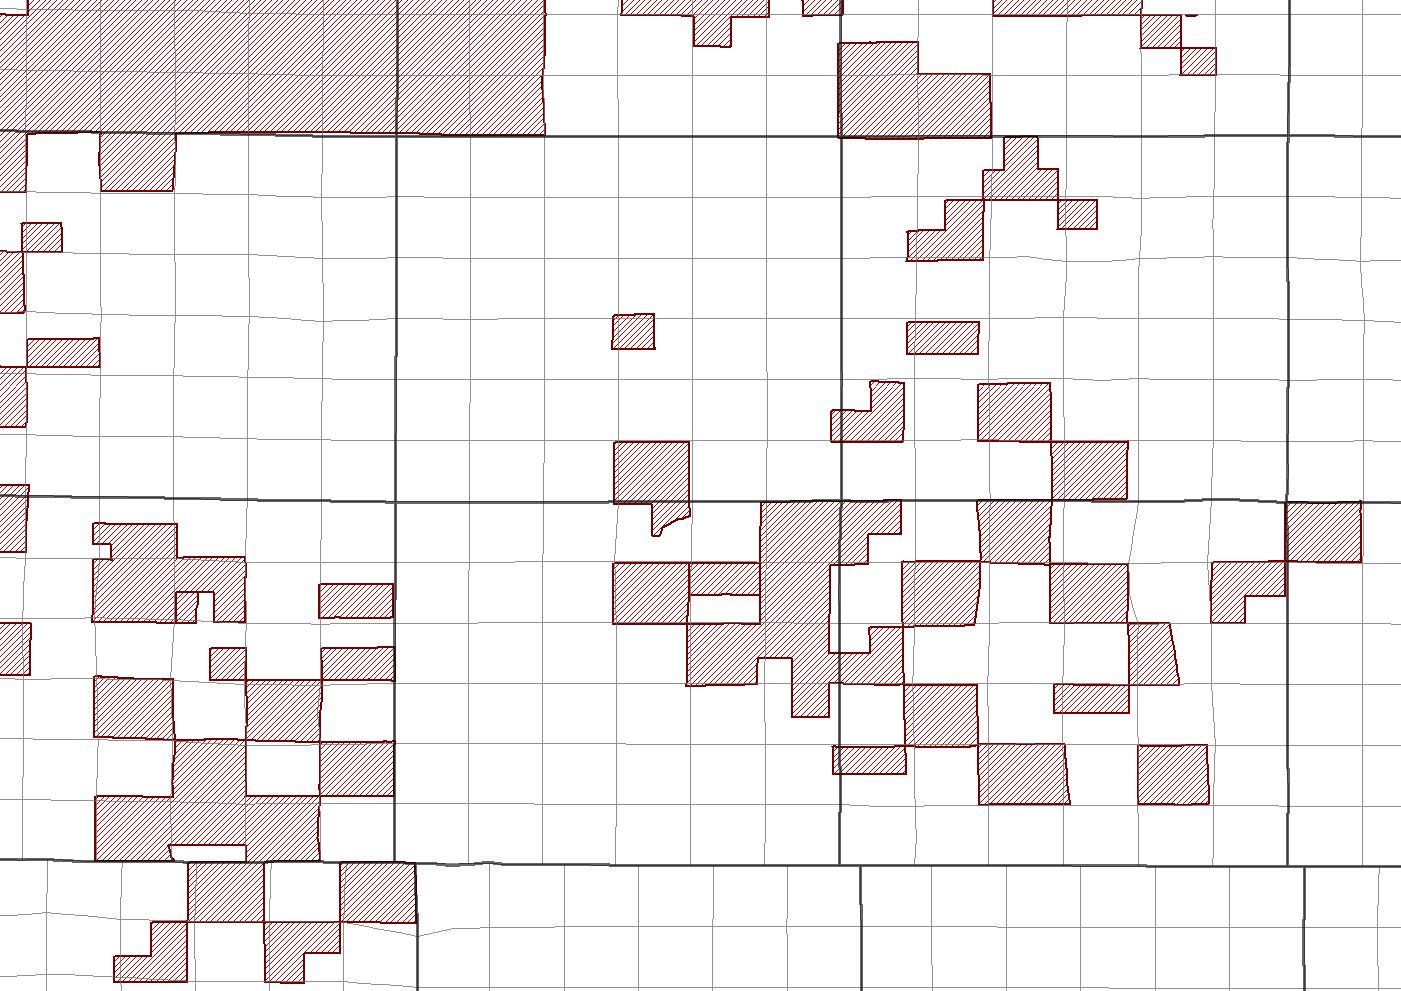
I am having an issue with the PLSS boundaries and AIANNH boundaries aligning with each other. Both datasets are plotting in the correct region, but the difference between the two datasets varies roughly between 600 and 1200 feet. See the attached screenshot. The red hatched layer is the AIANNH dataset. Is there a citeable explanation for this? Both datasets are in GCS_North_American_1983. I'm working with the most recent PLSS dataset for New Mexico (2016) along with the TIGER 2017 AIANNH dataset and am focused in the western/north-western region of New Mexico.
-
How big is the difference between the two datasets? Inches, feet, or miles? Are both datasets at least in the correct region? Is one of them located near null island? A screenshot would help.– cskCommented Feb 21, 2019 at 21:13
-
Good questions. I've updated my post to address your comments.– BRK92Commented Feb 21, 2019 at 21:32
-
Do you mean the hatched polys that don't always align with the more regular grid? That's just the way it is sometimes.– mkennedyCommented Feb 21, 2019 at 22:53
-
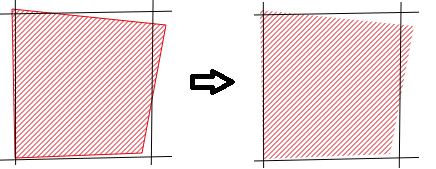
It doesn't look like the alignment is consistent. If the polys were consistently offset to one side, or the shape was consistently distorted, that would point to a projection issue. As it is, I think the issue is just that the AIANNH is not very precise.– cskCommented Feb 22, 2019 at 17:04
-
The occasional zig-zags in the PLSS boundaries look like the normal irregularities you would expect, due to the method of on-the-ground surveying that was used to create them. You can read about it here: en.wikipedia.org/wiki/…– cskCommented Feb 22, 2019 at 17:08
1 Answer
The occasional zig-zags in the PLSS boundaries look like normal irregularities due to the method of on-the-ground surveying that was used to create them. These boundaries were laid out by two people stretching a metal chain from point A to point B, then from point B to point C, and so on across the length and width of the entire state. Frankly, it's astonishing that they're as regular as they are. You can read more about it here: https://en.wikipedia.org/wiki/Public_Land_Survey_System#Survey_execution:_measurement
The irregularities in the AIANNH boundaries look like the imprecision that results from sloppy digitizing, or digitizing at smaller scale than you're currently viewing the data.
The description of the AIANNH boundary file available here on census.gov suggests the latter.
"The cartographic boundary files are simplified representations of selected geographic areas from the Census Bureau’s MAF/TIGER geographic database. These boundary files are specifically designed for small scale thematic mapping." (emphasis added)
What can you do about it?
You didn't ask, but in case you were thinking of trying to "fix" the data by snapping it to the PLSS layer...don't. Lack of data can't be fixed without additional data. Here are a few tips/suggestions about how to handle this:
Use styling tricks to make it less obvious that the layers don't line up. For example, removing the exterior boundary from the red-hatched layer.
If you produce a map at this scale with this combination of layers, I highly recommend adding a disclaimer about the imprecision of the data. The long history of deception, betrayal, and broken treaties between the US government and Native American tribes means that there are a lot of raw nerves you could be hitting.
Try to find a data set that's designed for large-scale mapping. Since these are legally defined property boundaries, that data set probably exists somewhere. Try the New Mexico GIS data portal.


