0

I am using QGIS to try and create a raster from 5m XYZ text point data. I imported using the tab delimited data function and points were created and located where I want them to be. I now want to convert them into raster but it appears the program is not recognizing my Z values. I could not find the Set Z Value function anywhere under Processing and tried the Vector to 3D function under the GRASS Processing menu. However it said the data source was not valid and I got no output. I wonder what might I have done wrong?

I saved the point file as shapefile but it still appears with a strage icon, the three dot icon attached.

enter image description here

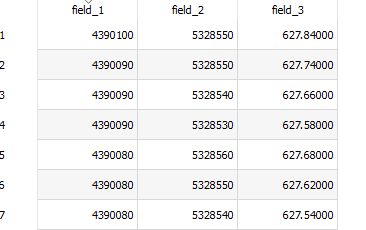
Here is a snip of the data which looks ok in the table and functions as a point layer until I try to do any height-related calculations.

enter image description here

2
  • 3
    Please provide more details about how you tried to convert the points into a raster.
    – Erik
    Commented Oct 14, 2020 at 9:37
  • 2
    Have you tried to interpolate indicating the field_3 as a Z value?
    – gvanhavre
    Commented Oct 14, 2020 at 10:39

2 Answers 2

1

If your point data forms a regular grid without any holes, you could use GDAL/OGR to create your DEM raster file. GDAL needs your data sorted by Y first, then by X.

  1. Rename your point shapefile (dem_points.shp) fields to x,y,z and save the following OGR virtual format file (dem.ovf) to the same directory (use your EPSG projection code instead of EPSG:31468 in my example)
<OGRVRTDataSource>
      <OGRVRTLayer name="dem">
            <SrcDataSource relativeToVRT="1">dem_points.shp</SrcDataSource>
            <GeometryType>wkbNone</GeometryType>
            <SrcSQL dialect="SQLITE">
            SELECT 
                CAST(ROUND(X(geometry),2) AS REAL) as x, 
                CAST(ROUND(Y(geometry),2) AS REAL) as y, 
                CAST(COALESCE(Z(geometry), -9999) AS REAL) as z 
            FROM "dem_points"
            ORDER BY y,x
            </SrcSQL>
            <LayerSRS>EPSG:31468</LayerSRS>
            <Field name="x" type="REAL"/>
            <Field name="y" type="REAL"/>
            <Field name="z" type="REAL"/>
      </OGRVRTLayer>
</OGRVRTDataSource>
  1. Open OSGEO4W Shell and change your current working directory to your file directory (i.e. C:>cd data\dem). Then call OGR2OGR.exe:

ogr2ogr -of CSV dem.csv dem.ovf

  1. Delete the first line (header) from dem.csv. You can use this file directly or call GDAL_TRANSLATE.exe to create a new TIF (dem.tif) for faster loading:

gdal_translate dem.csv dem.tif --config GDAL_CACHEMAX 1024 -co NUM_THREADS=ALL_CPUS -co COMPRESS=DEFLATE -co ZLEVEL=9 -co PREDICTOR=2 -co TILED=YES

  1. Drag dem.csv or dem.tif into your QGIS canvas
0

If your data is on a regular grid, (even with holes/missing data), sorted by y and x (y primary), as from the python code below, then the data can be imported directly as a raster.

# Make a random CSV xyz file compatible with GDAL
import numpy as np
x = np.array([(y, x, 1.0) for x in range(5328530,5328560,10) for y in range(4390000,4390100,10)])
x[:,2] = np.random.normal(size=x.shape[0])
np.savetxt("foo.csv",fmt="%8.1f %8.1f %8.5f",x,
           header="x y z",comments='')


x y z
4390000.0 5328530.0   1.69132
4390010.0 5328530.0  -0.96375
4390020.0 5328530.0  -0.96426
4390030.0 5328530.0   1.90196
4390040.0 5328530.0  -0.43301
4390050.0 5328530.0  -0.47332
4390060.0 5328530.0   0.44058
4390070.0 5328530.0   1.24625
4390080.0 5328530.0   0.01709
4390090.0 5328530.0   1.81022
4390000.0 5328540.0   1.48794
4390010.0 5328540.0   1.20569
4390020.0 5328540.0   0.08455
4390030.0 5328540.0  -1.33575
4390040.0 5328540.0   2.41027
4390050.0 5328540.0  -1.15869
4390060.0 5328540.0   0.41672
4390070.0 5328540.0   1.10926
4390080.0 5328540.0   0.22557
4390090.0 5328540.0  -0.65360
4390000.0 5328550.0  -0.49709
4390010.0 5328550.0   0.53986
4390020.0 5328550.0  -0.90243
4390030.0 5328550.0   0.09379
4390040.0 5328550.0   0.16449
4390050.0 5328550.0   0.55429
4390060.0 5328550.0  -0.55609
4390070.0 5328550.0  -0.78839
4390080.0 5328550.0  -1.76425
4390090.0 5328550.0  -1.31797

This data can be read directly from Layer/Add Layer/Add Raster Layer/ Dataset tool.

If your data isn't a regular grid, and you already have the points imported as a layer, with the accurate fields, then the problem might not be with your data import, its with transforming the point data into a raster, as in Interpolation on set of points in QGIS or this QGIS tutorial. You should be able to use one of the interpolation tools Processing /(search 'interp') tools like Processing/Interpolation/IDW Interpolation, Processing/Interpolation/TIN Interpolation, Processing/SAGA/Raster Creation/Interpolate or others.

2
  • Thank you for this informative answer! I have 2 follow up questions: 1. Can you suggest any good python for Q tutorials? I do not really have the foundations so I dont want to just plug lines without understanding what Im doing. 2. Is there any reason I cannot find the Interpolate tool anywhere? Do I need to set it up somehow?
    – Vita
    Commented Oct 20, 2020 at 7:30
  • I found several interpolation tools using the Processing/Toolbox menu item and then started typing 'interp' in the search box. Does that not work for you? I ran my python code outside of QGIS in Anaconda, and just for generating a sample file to play with. I know python far better than I know QGIS, so I'd only be able to point at the QGIS guide like docs.qgis.org/3.10/en/docs/user_manual/processing/console.html
    – Dave X
    Commented Oct 20, 2020 at 17:57

Not the answer you're looking for? Browse other questions tagged or ask your own question.