I wonder if it's possible to display a map in the layout/print composer when another is shown ?
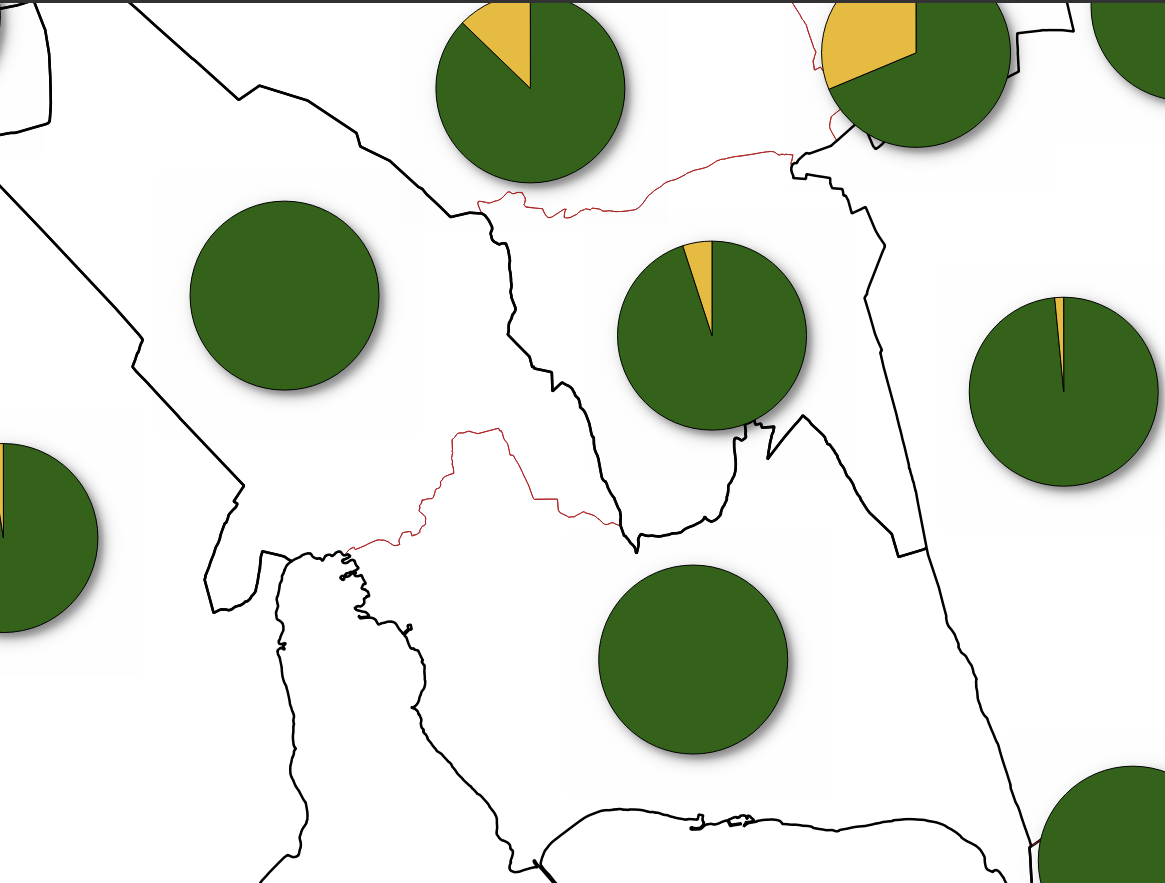
I have this layer  where I've made some statistics with diagrams. It shows the percent of people that are "ok" and "not ok" inside of a specific county.
I want to display each diagram based on the counties with the atlas generator. I've already achieved that. Moreover, each county contains many cities and I want to show their statistics on the same page of the atlas.

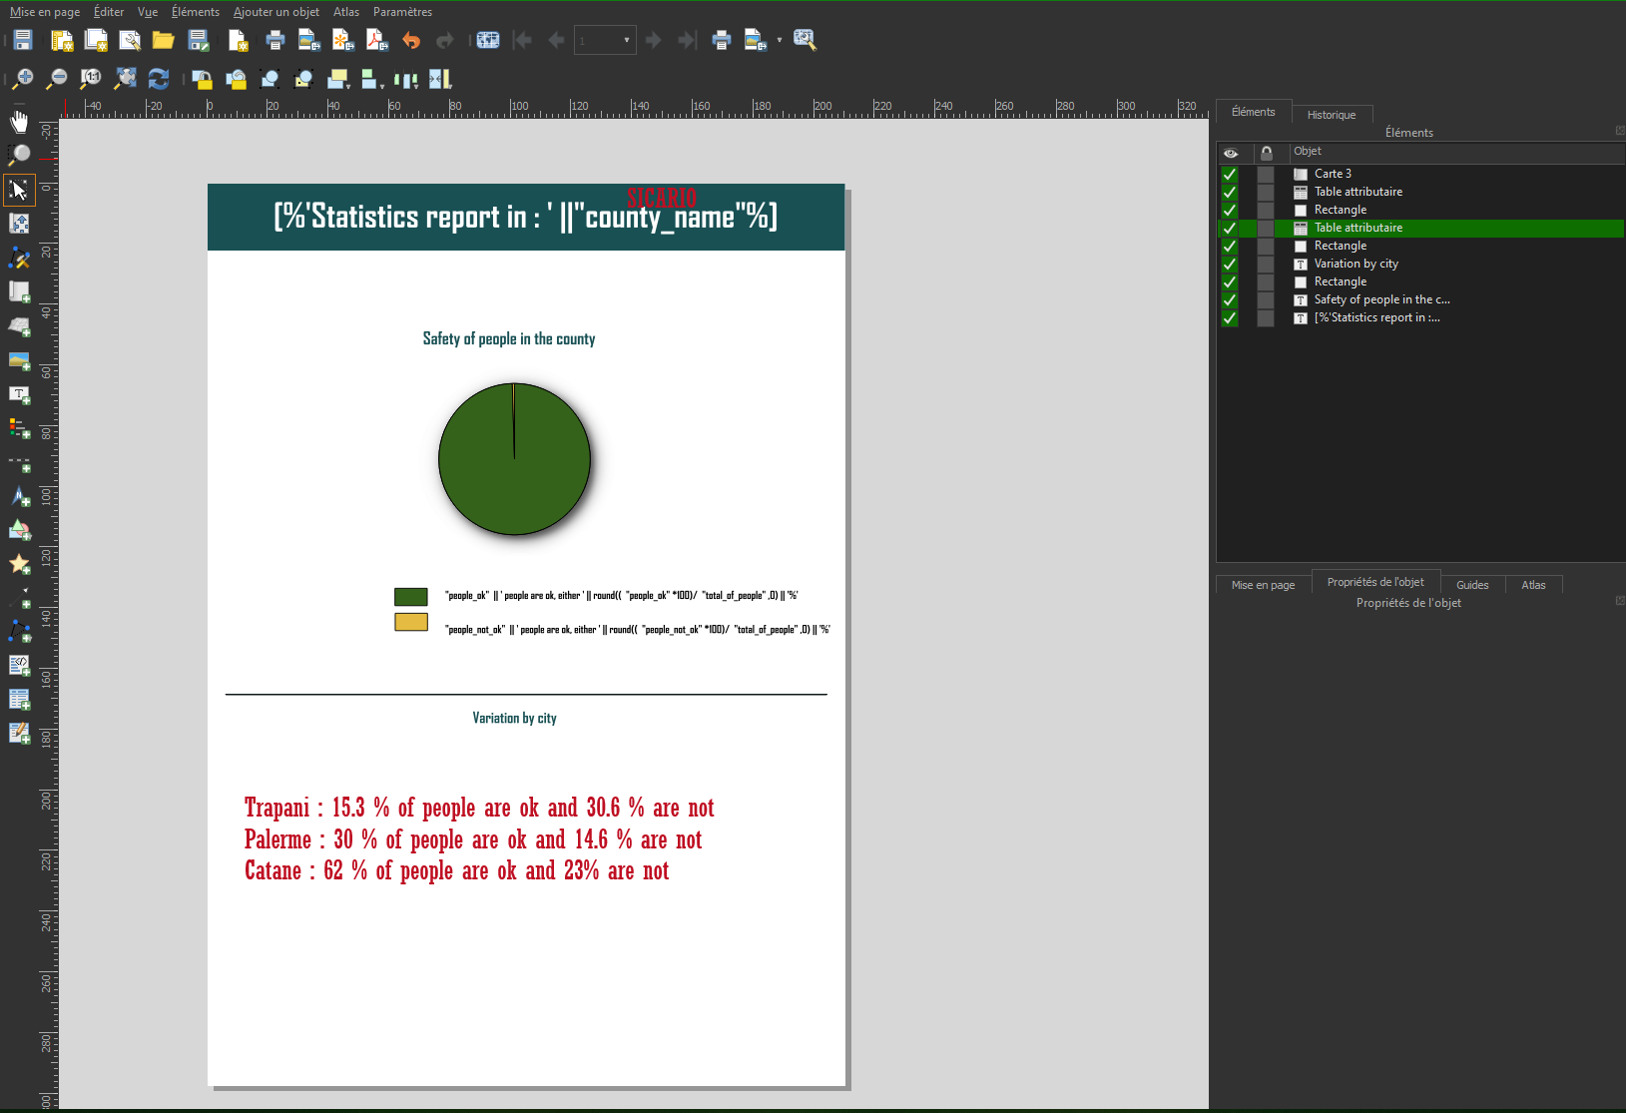
To show you the result that I would like to achieve I've made this example. Let's say that the page shows the statistics for the Sicario county (in red is what is supposed to be show). Below the item "variation by city " I would like to have the statistics for the 3 cities that belong to this county: Trapani, Palerme and Catane.

**Is ther anay way to linked my first diagram with the display of the statistics by cities with some condition ? **
Like if "Carte 3 " (which is the view of the diagram) show Sicario then in "Variation by city" put the cities statistics that belongs to Sicario county
It's very complex...
