So I have a bit of an issue of points with the same x and y that I need to display separately from themselves. Here is some history of this issue:
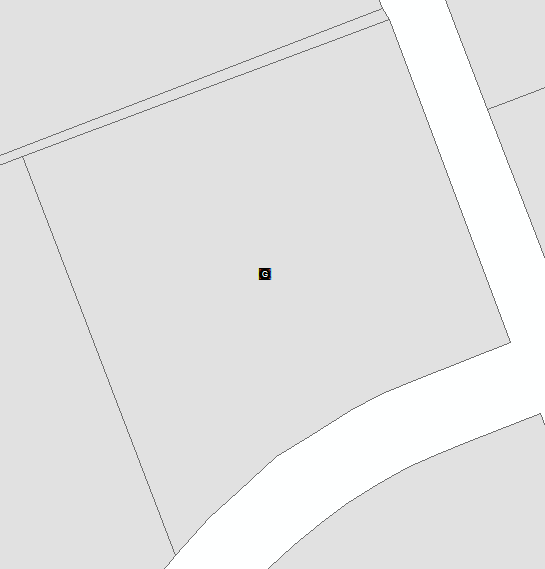
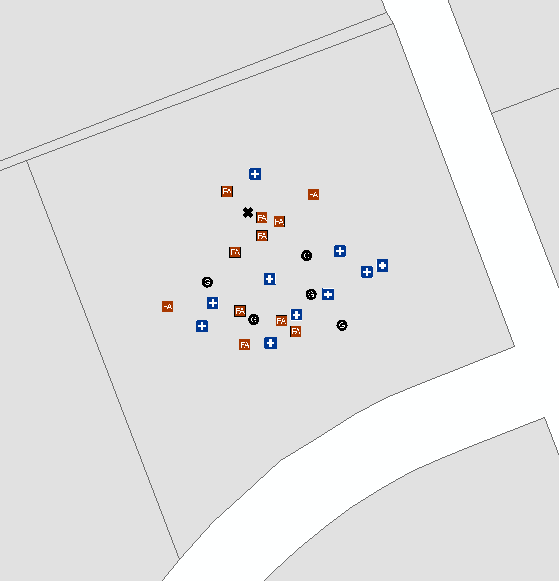
I have a database of incidents that happen over a county. These incidents join to a parcel fabric with a one-to-many relationship. So several incidents occur on one parcel. I need the incidents to be shown as a point feature class for a web mapping application. So I added the x and y centroid of the associated parcel and created the point feature class. This resulted in several points being drawn on top of each other as shown in this picture:

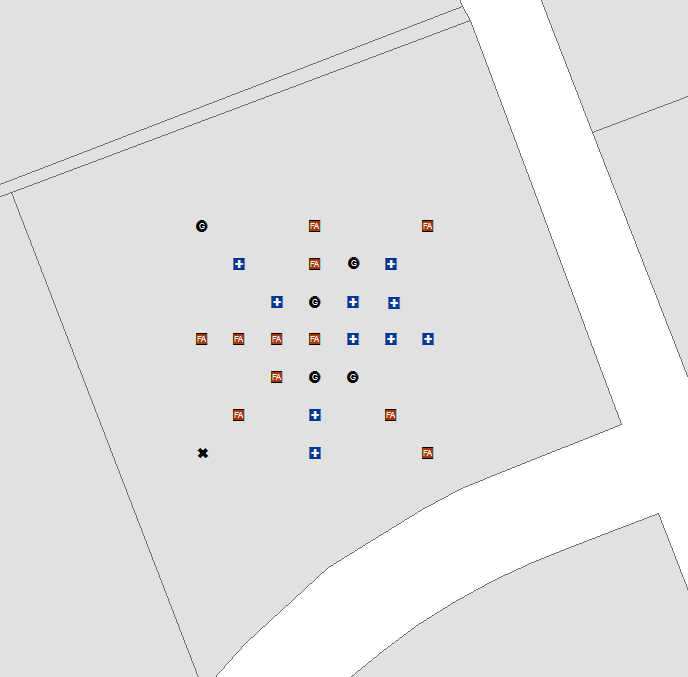
I converted the symbology to a representation with a 10 meter minimum gap between points which resulted in exactly what I was looking for as show in this picture:

Now this works great in ArcMap, but when uploaded to my web mapping app the points can only be identified at there original x and y. So when you identify points that have been spaced you get no result, but when you identify the center of the parcel you get several results.
What I would love to happen is to somehow return the xy of these representations and change xy of each point to that. I've tried a few programming solutions, but I haven't been able to solve it yet.

