12

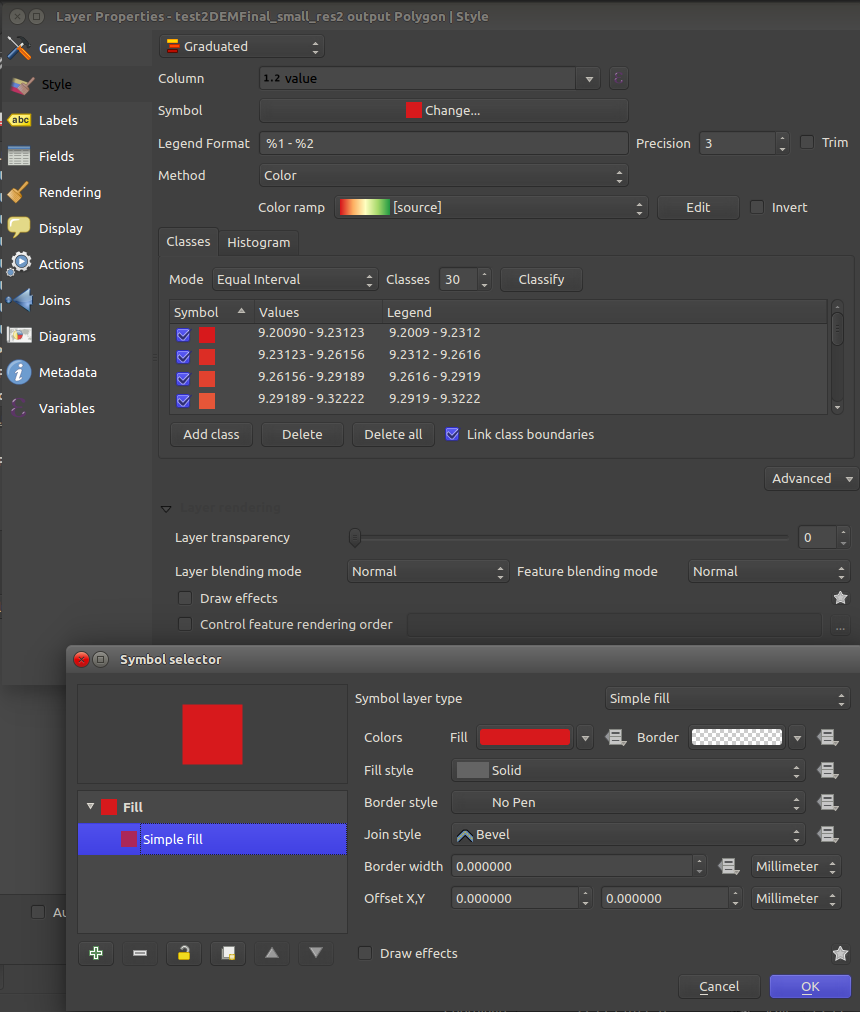
I have a GML layer representing a hexagonal grid that I would like to include in some maps. In QGIS 2.14.2 I applied a graduated style and completely removed the polygon border:

enter image description here

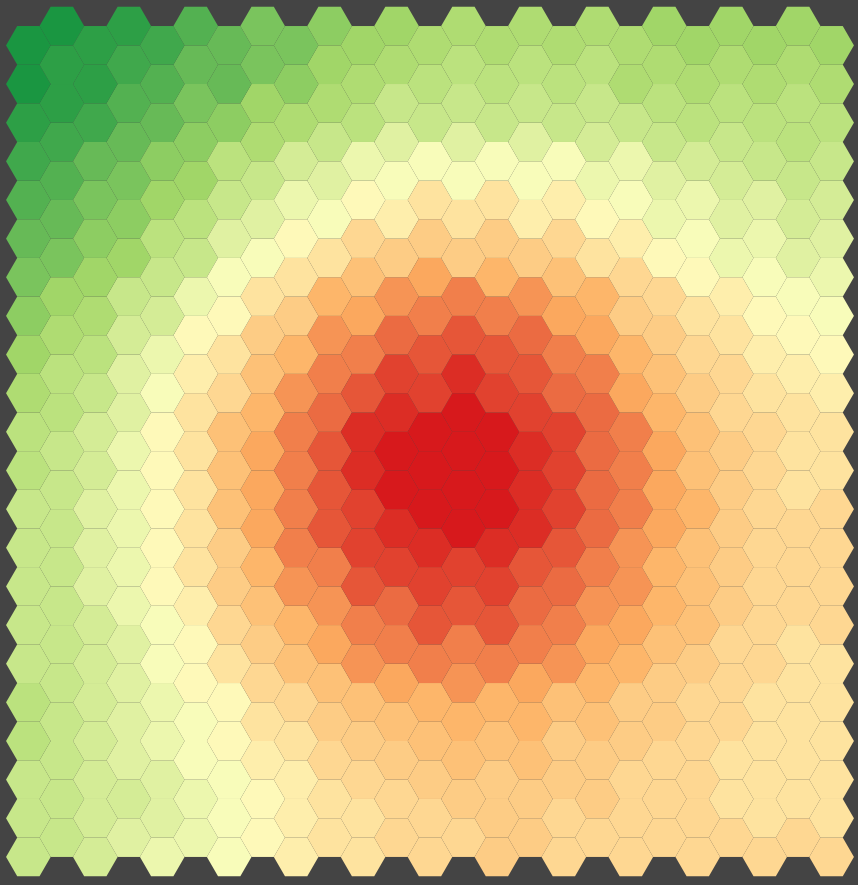
However, in the map canvas the borders are still being portrayed:

enter image description here

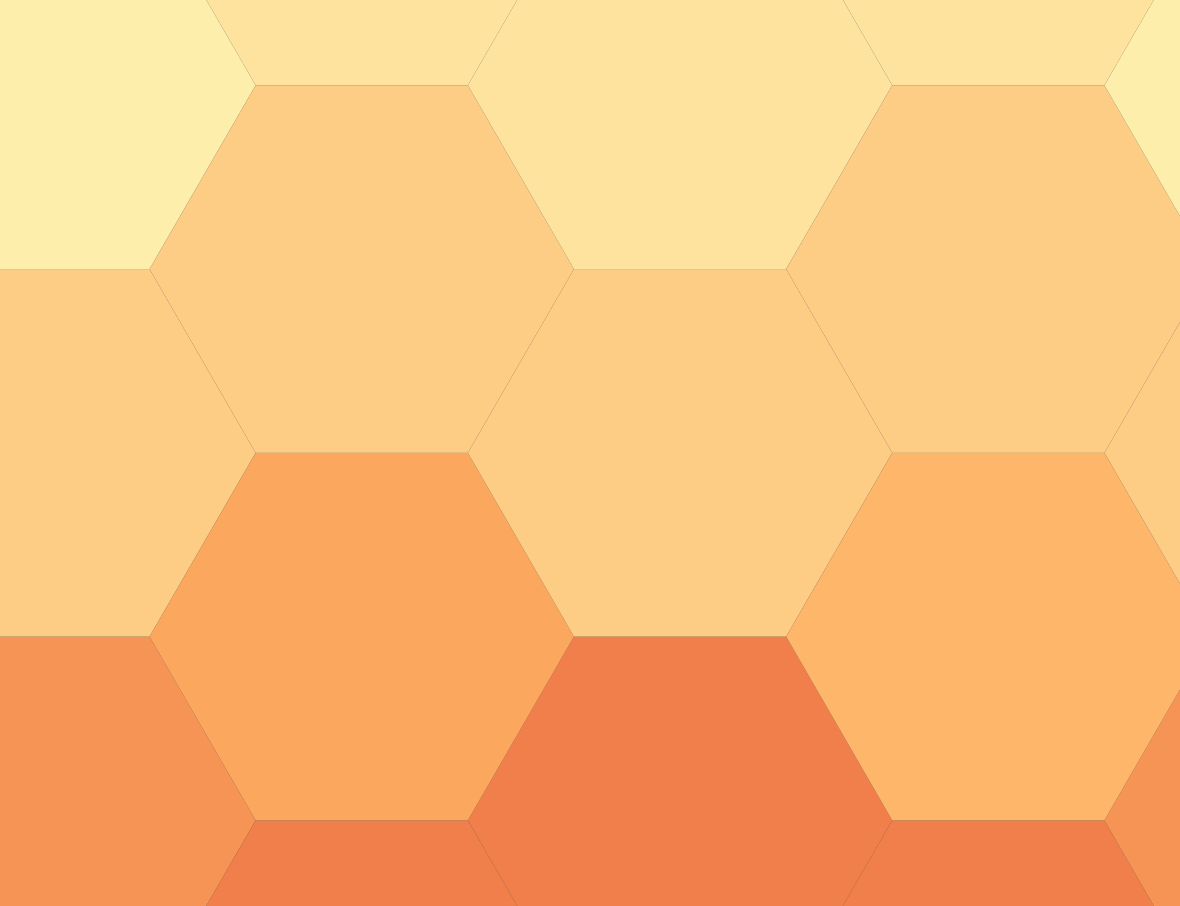
Zooming in one can see the border around each polygon, it is thin, but it is still there:

enter image description here

Suspecting this was an issue with the map canvas itself, I tried to produce some maps with the Print Composer. Even in vector format, the polygon borders are portrayed. Please check these files:

Is there any way to force QGIS to remove these borders?

2
  • 2
    If the user is selecting "no Pen" for the border, but the border still gets rendered, should not this be reported as a bug? Commented Jul 12, 2016 at 13:08
  • It is a long standing issue and is tracked in github.com/qgis/QGIS/issues/12023 Commented Nov 25, 2021 at 11:27

4 Answers 4

8

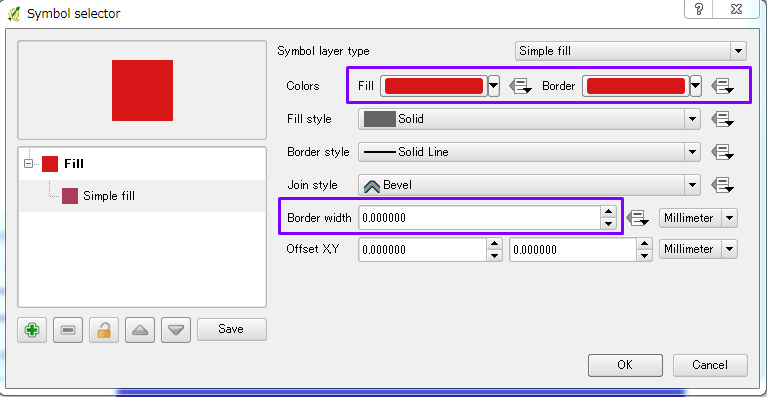
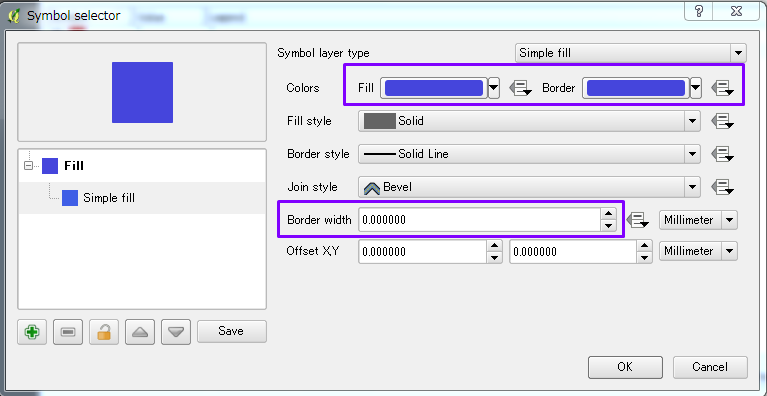
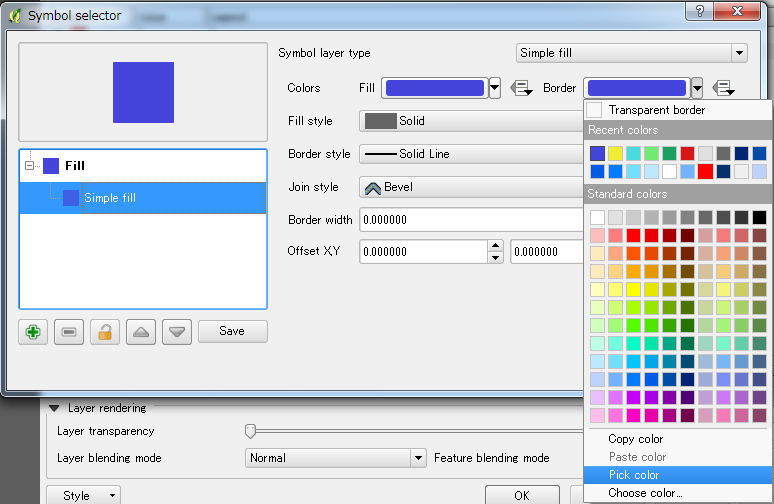
The only way to that is to set the border color same as the fill color, then the border will disappear. You can keep setting the border line width is zero. Use 'Pick Color' to select exactly the same color from fill color.

enter image description here

enter image description here

enter image description here

Use Pick color to make the border color same as the filled color by selecting the filled color

enter image description here

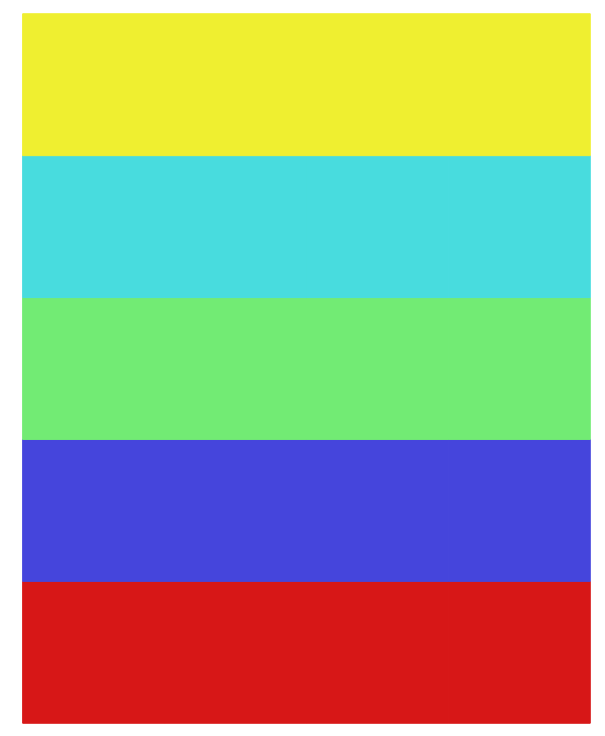
The legend will look like this

enter image description here

And the final output is like this.

enter image description here

8
  • Like that I get a red border around each polygon. Which QGis version are you using? Commented May 20, 2016 at 8:57
  • 1
    You need to select the same color for each filled color. For example red fill -> red border, Blue filled -> blue border, and so on. That is why you need to use Pick color tool under the border color to pick the same filled color.
    – ahmadhanb
    Commented May 20, 2016 at 9:24
  • I spent the last 20 minutes modifying each and every class style and the result is exactly the same. Commented May 20, 2016 at 9:53
  • I updated the answer for more information.
    – ahmadhanb
    Commented May 20, 2016 at 10:03
  • 1
    The reason it hasn't worked for you is because you still have your border style set to "No Pen", so any changes you've done won't show. Change it to "Solid Line" and you should see the difference Commented Jun 1, 2016 at 10:35
5

choropleth-gen

Tired of creating choropleths by hand for QGis I decided to create a little code package for the purpose. It has the suggestive name choropleth-gen and can be installed from PyPi, issuing a command like:

pip install choropleth-gen

The package installs two scripts in the system: gen_greyscale_choropleth and gen_spectral_choropleth. Both these scripts take the same arguments, identified with specific flags:

  • -b - bottom value in the choropleth.
  • -t - top value in the choropleth.
  • -c - number of colour classes to generate.
  • -o - path to the resulting SLD file.

Example:

gen_spectral_choropleth -b 10 -t 50 -c 20 -o style.sld

2
  • 1
    Luis, just wanted to thank you for your script. Used it today, and it was very helpful!
    – Matt
    Commented Aug 30, 2019 at 19:35
  • 1
    While nice, this really has nothing to do with the question about QGIS and really should not be the accepted answer. Commented Nov 25, 2021 at 11:28
5

A way of doing this a little faster than @ahmadhanb (if you work with a color ramp for coloring) is to use the assistant by clicking on the symbol on the right and selecting "assistant" enter image description here

In the "source" field you can insert the expression @symbol_color to receive the color that is used for the symbol's filling.


If you need other coloring schemes, you can insert this or other rules:

CASE
WHEN "FieldNameYouUseForColoring"<200 THEN 0
WHEN "FieldNameYouUseForColoring"<400 THEN 1
WHEN "FieldNameYouUseForColoring"<600 THEN 2
END

Next, restrict the range to (0,2) and select the color ramp you would like to select.

1
  • 4
    You can use @symbol_color as expression, that will use the main color of the symbol. That way you do not need additional rules. Commented Nov 25, 2021 at 11:29
1

The Merged Features Renderer will let you render adjacent polygons as one polygon, while still being able to use sub-renderers such as the graduated or rule based ones. The polygons will appear as one, but can still be selected, labeled or identified individually.

If you have already set up a graduated renderer or a rule based renderer prior to switching to the Merged Features Renderer, the previous renderer will be turned into a sub-renderer of the Merged Features Renderer upon switching, with render settings such as rules and styles intact. Also, switching back from the Merged Features Renderer will transfer sub-renderer settings to the new rule based renderer. For graduated renderers etc., convert so rule based before switching back, to preserve classes/styles.

This is the simplest and fastes approach, and you don't have to set set border colors. The alternative approach, the same-color-hairline-border-workaround, in addition to require more work actually obscures parts of the neighbours, resulting in an unclear rendering of thin neighbour polygons when zooming out.

Your Answer

By clicking “Post Your Answer”, you agree to our terms of service and acknowledge you have read our privacy policy.

Not the answer you're looking for? Browse other questions tagged or ask your own question.