2

I'm looking for a way to vector-map Birmingham population densities by Lower Level Super Output Area (LLSOA). I have two sets of relevant data: the ONS LLSOA boundary set, and ONS estimates of population density. The LSOA boundary set is georeferenced, and assigns each area an ID. The density data has no lat/lon info. Instead, it refers to the LSOA ID number.

Does CartoDB have a relatively simple way of correlating the LSOA ID of each table? Is this simple using an SQL query, or another method?


--- Update based on rethinking the question ---

Since my overall aim is to render a density map with a colour gradation, I realised that with CartoDB, it's a polygon rendering scheme I'd need, and that I'd need to assign a numeric banding within the data table. I've done that by editing a text file and uploading it.

Given that I've been text-editing the tables in KML format, I looked for KML tags that would be useful. Ultimately I'd want to use the POLYSTYLE tags. But in advance of studying those, I just did a simple ranking using the SNIPPET tag.

With that in mind I took the highest density number and divided it by 10, then filled the SNIPPET column with those numbers. Once that was uploaded, I edited the rendering settings to assign a colour band to each level.

https://dglp.cartodb.com/viz/e69b5048-a9f4-11e5-8b02-0ecfd53eb7d3/public_map

This gets me most of the way to my original aim, and is good enough to share with others. It's taken several hours of foooling around with text and spreadsheet editors; probably much longer than doing the merging online.

There are other boundaries I want to add in, so I'll continue with the JOIN or MERGE approach and report back with the outcome. Aside from that, other questions have come up - like how to do other sorts of renderings - which probably ought ot be set out as new queries.

7
  • Hello, welcome to GIS.stackexchange. I don't fully know your data, but CartoDB's backend is PostgreSQL, so you can perform a variety of different joins in SQL. Also could you post some sample data?
    – raphael
    Commented Dec 23, 2015 at 14:24
  • Thank You @raphael! I've had a quick look at the JOIN syntax, and guess that I'd want to do an INNER JOIN that adds LLSOA georeferencing to the population table. (Or the other way round.) Oops, not done composing this yet! Want to add some data rows.
    – dglp
    Commented Dec 23, 2015 at 18:18
  • Not sure what to do re samples. The two rows I'd consider adding are a total of 19000 characters - because one row has a polygon....
    – dglp
    Commented Dec 23, 2015 at 18:34
  • I'd say post only the relevant attributes, the well-known text of your geometries is not relevant for this question.
    – raphael
    Commented Dec 23, 2015 at 18:58
  • OK, here are some abbreviated table.column names: llsoa_2011.lsoa11cd and bham_density.llsoacode each contain the area ID. For the population density/sqKm, bham_density.ppsk contains a decimal number. The polygons in llsoa_2011 seem to be defined by several shape_area and shape_length columns. I'm supposing that I could join the density.ppsk column into the llsoa table, and somehow render the polygons using that new column. Is that useful?
    – dglp
    Commented Dec 23, 2015 at 19:36

1 Answer 1

1

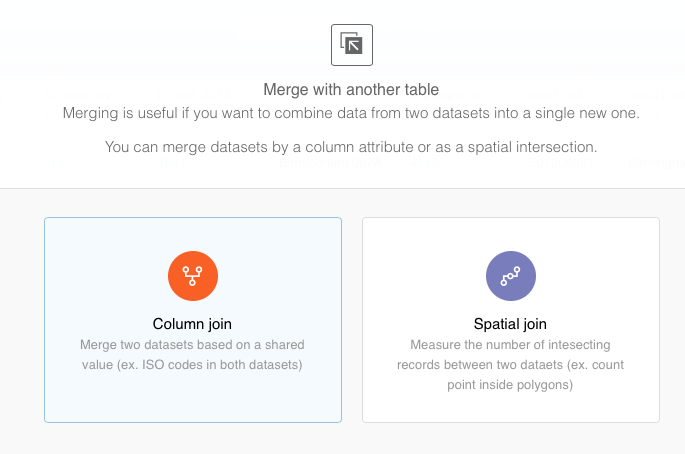
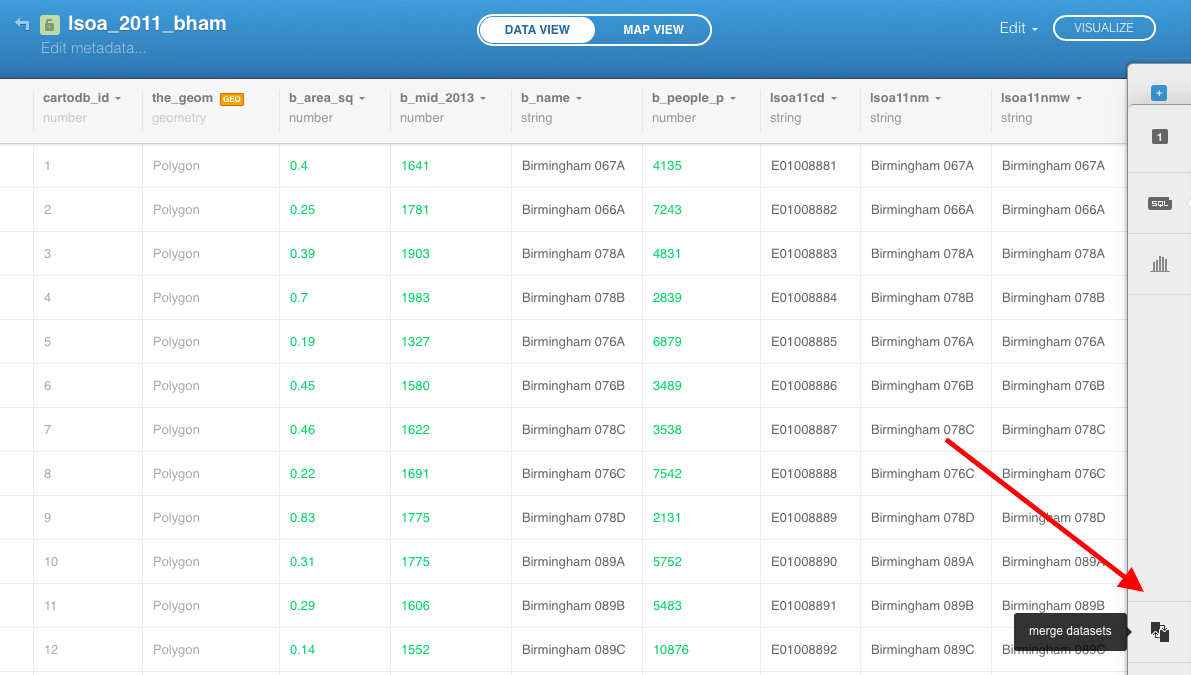
In addition to @raphael 's suggestion to perform a join in SQL ( - if you want to do this perhaps this helps and this - ) you can also use the merge wizard in CartoDB. As you suspect, you can use the area code as the unique identifier to join the population density as an attribute to your shapefile.

In this example I have uploaded the following two data sets to CartoDB:

enter image description here

  1. Select Column Join

enter image description here

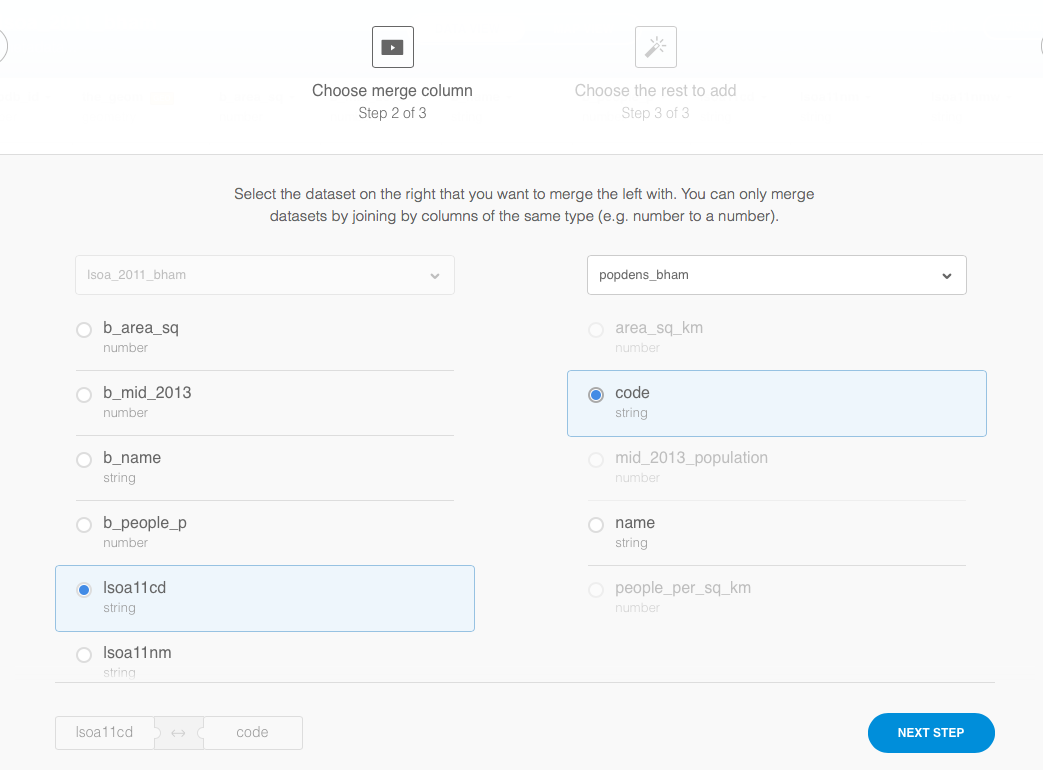
  1. Determine the merge columns with the unique area identifier (in this case lsoa11cd and code)

enter image description here

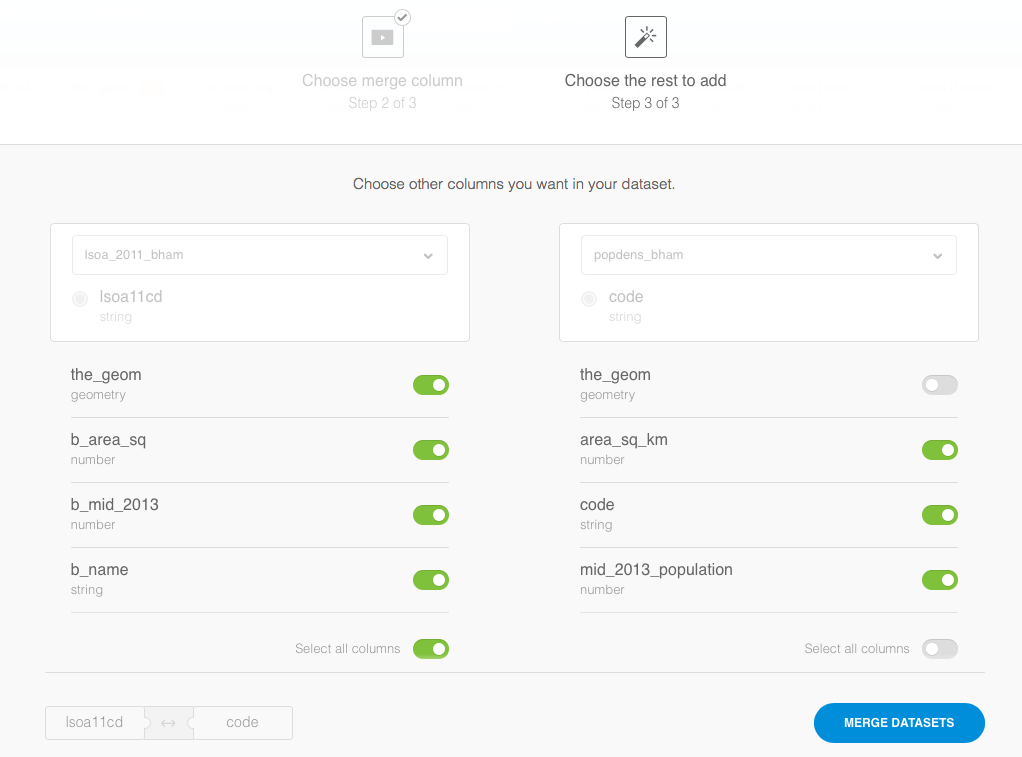
  1. Determine the columns you want to join (in this case I left the default)

enter image description here

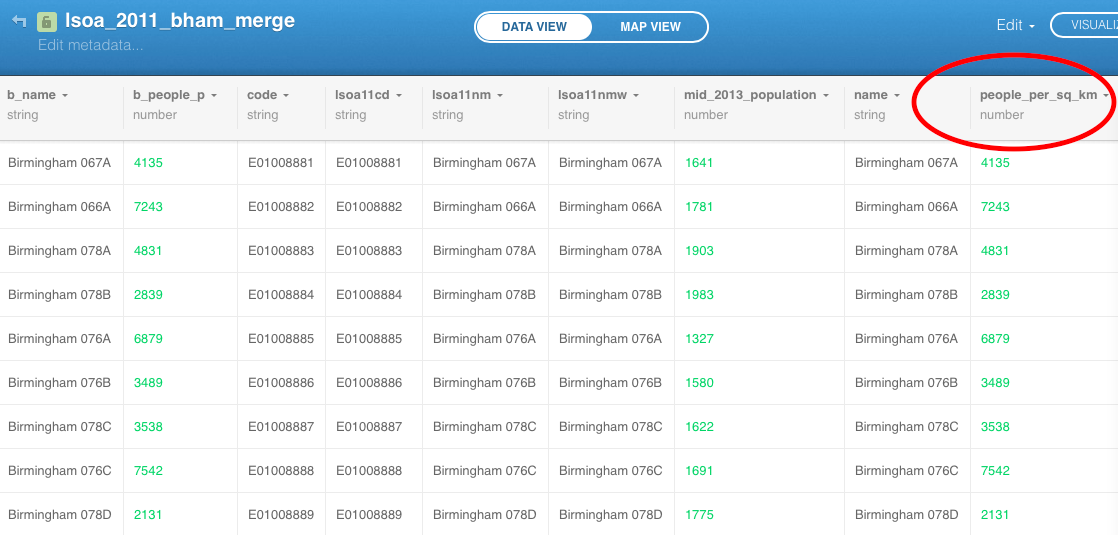
  1. This creates a new table lsoa_2011_bham_merge with the added fields, including peple_per_sq_km that you can now visualize.

enter image description here

1
  • that's much simpler than handcrafting the text file! Thank you. That said, I've merged my own data, and there's persistent lack of data in the merged population and density columns, or in the cases where I get the density data across, the rendering wizard limits the colour range to a half dozen or so examples - so I'd have to do a bunch of work to expand that set. It looks like the easiest approach is to create some additional tables and merge them one at a time. I'll try your data too.
    – dglp
    Commented Dec 24, 2015 at 13:12

Your Answer

By clicking “Post Your Answer”, you agree to our terms of service and acknowledge you have read our privacy policy.

Not the answer you're looking for? Browse other questions tagged or ask your own question.