13

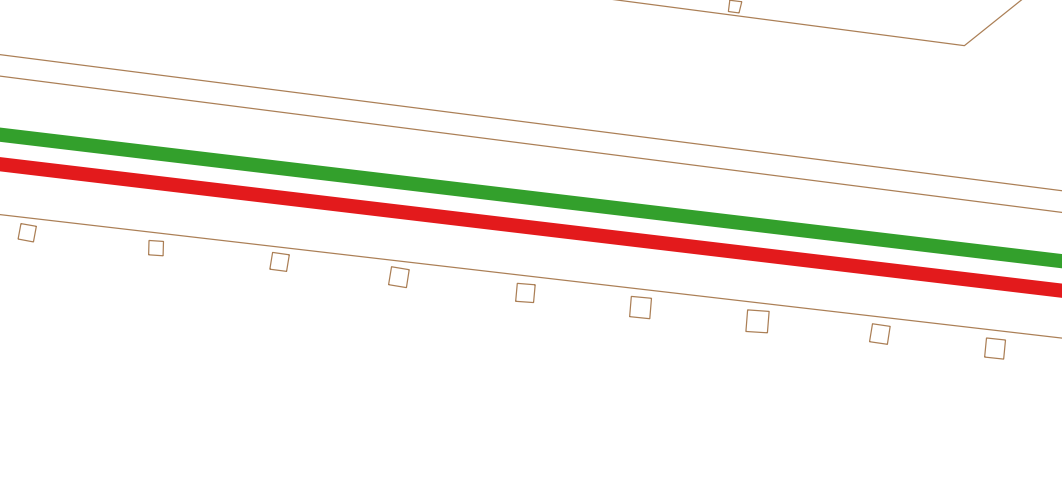
I have to draw a map of a public bus transport network and i have a problem in the avenues where a lot of lines passes by. My objective is to make a visual map where the lines in those avenues are parallel one from the other and with no space between them, in order to see all of them at the same time, regardless the scale.

I've tried snapping options, and parallel drawing (CAD tools), but the issue is that when i change the scale, the distance between lines change and they collide or separate one from the other, messing everything.

So my question is:

  • Is there any option to draw adjacent lines that stays adjacent independently of the scale of visualisation?

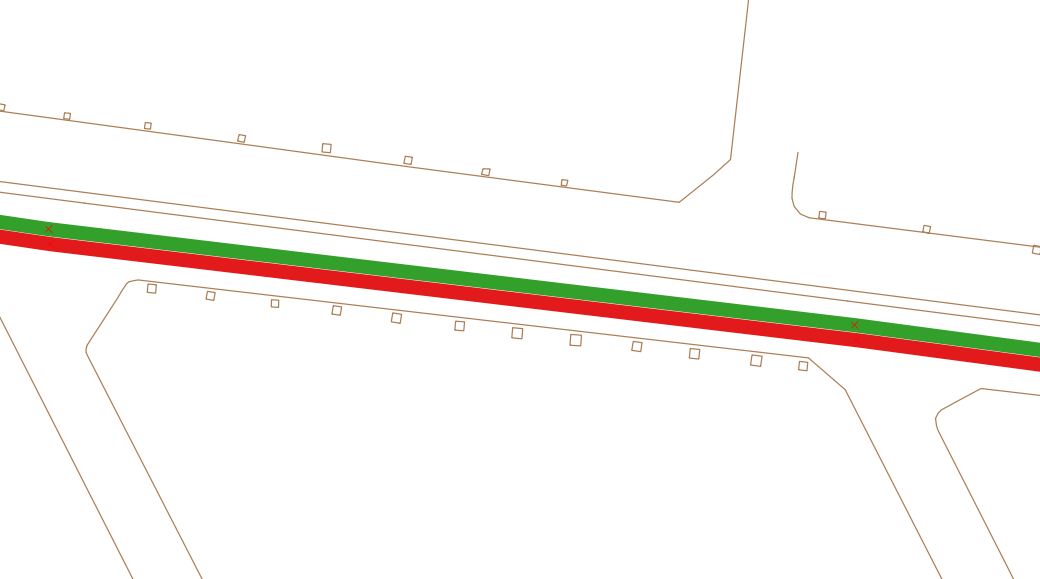
Note: I don't know if adjacent is used for what I mean, so here I copy an example of what I'm searching for: Objective

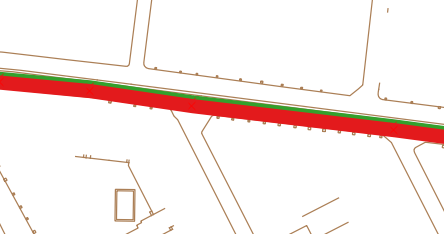
This is what happens when I zoom in:

Zoom in

And when I zoom out:

Zoom out

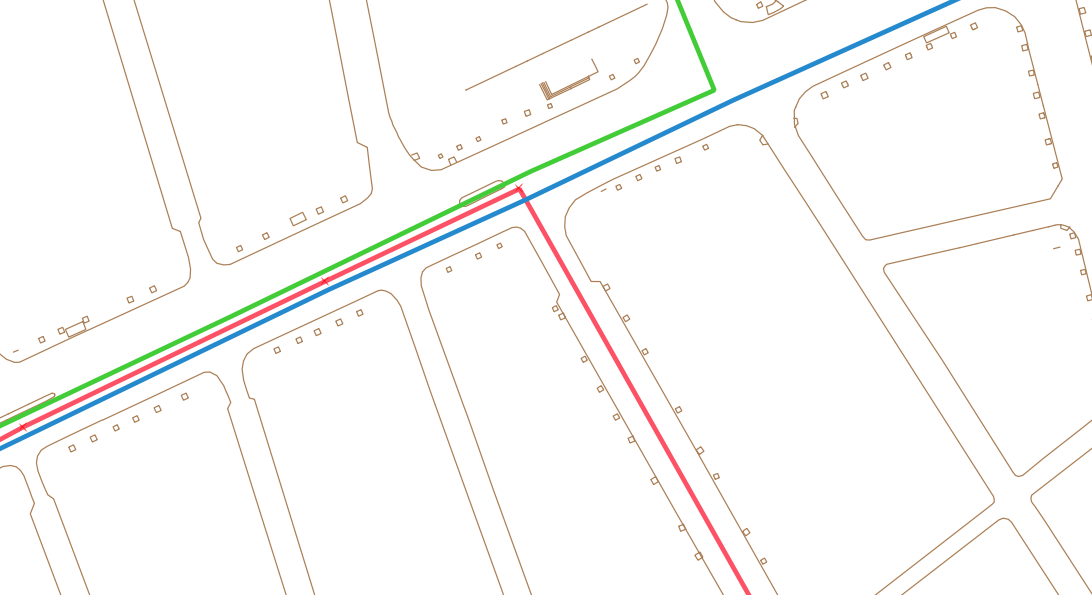
EDIT: Here I share a situation of why the suggested solution wouldn't work for me. Three lines share the same street for a while, but then they separate into three different streets.

Split

I can't use a single line with several symbolisation because all along the network, the lines split and join again (there are more than 15 bus lines).

The data contained in the attribute data doesn't help me, because it's only a layer full of lines, with no attribute other than some network information (number of buses/hour, passenger/hour, etc.). (QGIS 2.8.6 working on Windows 7)

9
  • 1
    In QGIS 2.16, new rendering simplication options were introduced. Although I can't confirm if this will help in your situation.
    – Joseph
    Commented Sep 23, 2016 at 13:02
  • The way that I would do this in ArcGIS for Desktop is by setting a reference scale on the data frame.
    – PolyGeo
    Commented Sep 27, 2016 at 8:09
  • Hi @PolyGeo, the problem with this solution (that can be implemented in QGIS, changing the units to "map unit") is that I need the lines to change their width depending on the scale but not the relation between them. I know that what I need is something very specific and difficult to implement. Something more appropriate for Illustrator than for a GIS software. Thanks for helping! Commented Sep 27, 2016 at 12:20
  • Do all the line shapefiles lie on top of one another or is there already some sort of offset between then?
    – Joseph
    Commented Sep 27, 2016 at 14:50
  • In some cases they lie on top of one another and in other cases they don't. What do you propose? Commented Sep 27, 2016 at 15:41

2 Answers 2

6
+50

Not sure this is what you are really after, but you can use a single line with a different symbolisation to create the appearance of two parallel lines.

Starting with a 1.1 km line in CRS 3857 (metric, pseudo-Mercator as per Google and other web services):

enter image description here

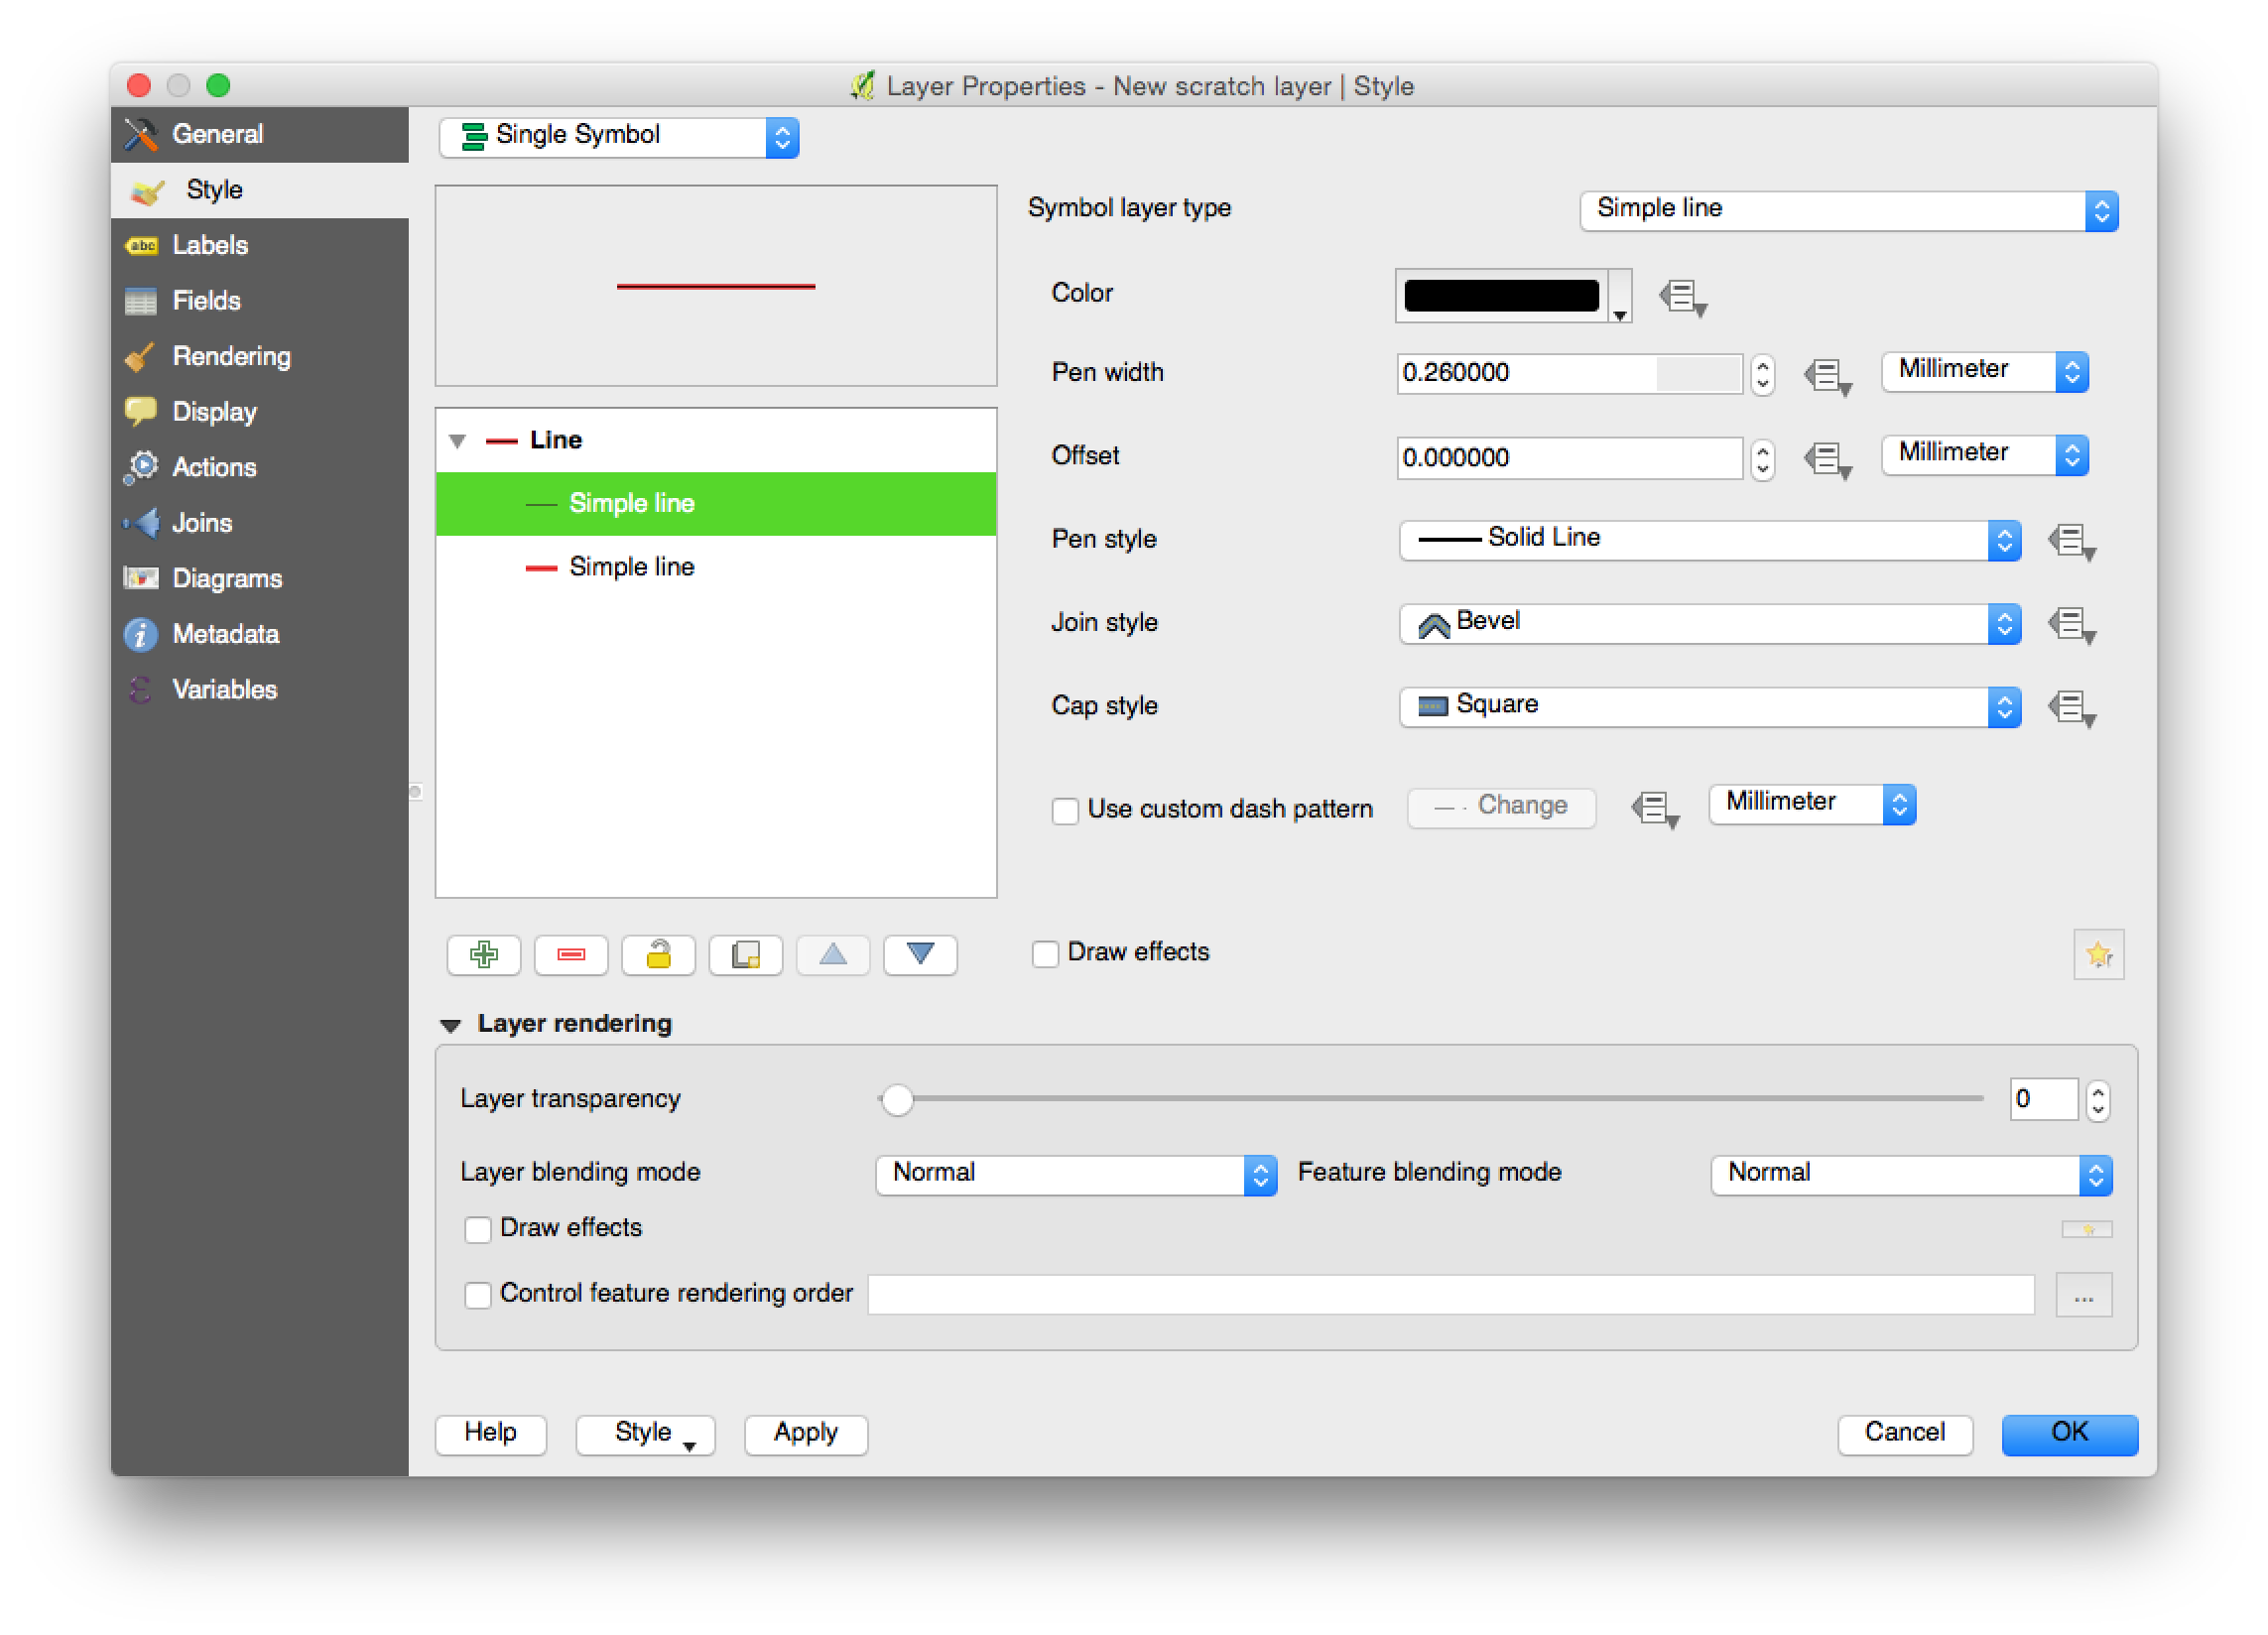
In properties, add another symbol layer (so you see two lines).

enter image description here

Set the width of each line in map units - in this case, the units are metres and I've selected a width of 50 metres, and set the offset of each line to half their width, with one of them having an equal but negative offset:

enter image description here

This gives the appearance you're after:

enter image description here

... and it persists at different scales:

enter image description here

5
  • 2
    I thought about this but that would be difficult to deal with at separations of lines.
    – Victor
    Commented Sep 23, 2016 at 13:55
  • @Victor about separation: you can create different attributes like "single line", "double line" with value True/False and use rule-based labelling. Commented Sep 23, 2016 at 14:22
  • 1
    @Victor agreed, need to get more info from OP about the nature of the data; this solution may not work depending on how lines connect and separate.
    – Simbamangu
    Commented Sep 23, 2016 at 14:31
  • 1
    @Andreu, perhaps you can click 'edit' on your original post, and add that information (and an example of where this solution wouldn't work), and (better yet) some sample data?
    – Simbamangu
    Commented Sep 26, 2016 at 12:19
  • @Simbamangu First of all, thanks for trying a solution and sharing it with me. Even if that solution can work in some cases, as Victor said, it would be difficult to use it when lines separate from the others. In fact, that happens everytime the lines split into different streets. The data works like that: I have all the lines of the Bus network in different shapefiles. The "problem" is that all of them are reallistically plotted, so when I choose more than one at a time, they collide. So my objective is to make a map where you can visually see the whole network. I'll edit my post. Commented Sep 26, 2016 at 12:23
3

If by "snapping option" you mean that you cannot change the geometry of the polylines and you can only change their symbology, then what you described is almost impossible.

From your examples, you seem to be looking to render polylines such that the parallel portions touch each other without overlapping, e.g. by having the boundary between the two parallel lines equally divide their separation distance. If we view the polyline representations as their buffers, then you can come up with cases (similar to your Fig. 4), where the same line should have different "buffer" widths at different portions (dictated by the closest neighboring lines). In other words, your buffer width would depend on other polylines and can vary at different segments of the polylines. But typically, symbolization only uses information/attributes of the feature itself.

Of course, you can always use a fixed radius "buffer" around the lines, and manually manipulate the vertices (or edit the buffers) so that the boundaries snap to each other . Then the buffers would remain "snapped" with zoom in/out, although this is a lot of manual labor and adjustment may be required if new lines are added.

2
  • Thank you for the answer. I can change the geometry of the polylines, but since there are a lot of lines crossing each other and a lot of different combinations, it becomes very time-consuming and tedious. I've tried the buffer solution, but it is even harder than just editing lines shape, because if have to define dependant visualisation in all the segments of all the lines. Commented Nov 23, 2016 at 14:50
  • 1
    @AndreuAmoros. This is exactly what I was suggesting. Editing the lines (or the associated "buffers") is indeed time consuming, but it is needed by the nature of your requirement that these buffers snap to each other.
    – tinlyx
    Commented Nov 23, 2016 at 20:14

Your Answer

By clicking “Post Your Answer”, you agree to our terms of service and acknowledge you have read our privacy policy.

Not the answer you're looking for? Browse other questions tagged or ask your own question.