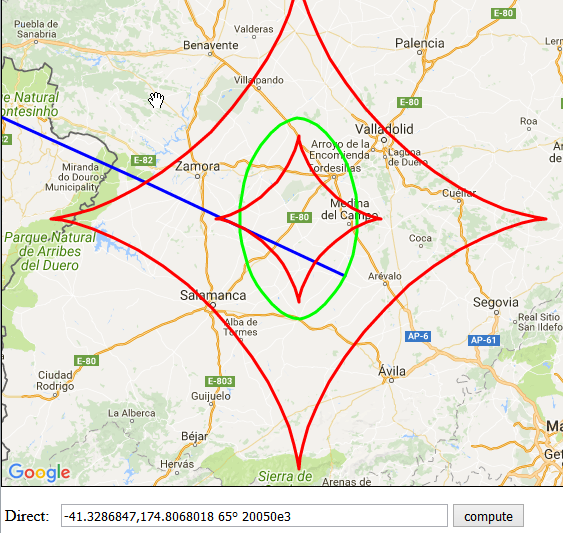
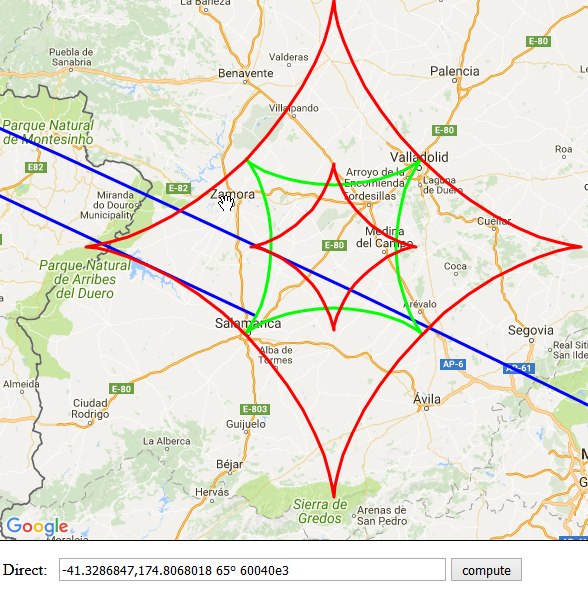
It looks like you've figured things out OK. In case it helps, I give here the MATLAB/Octave code that I used to generate this Wikipedia figure showing the envelope:
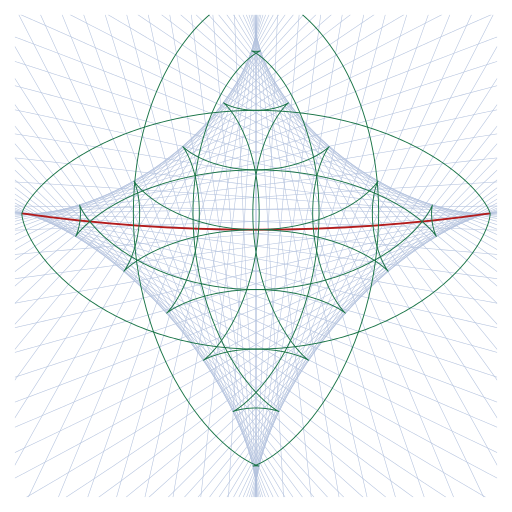
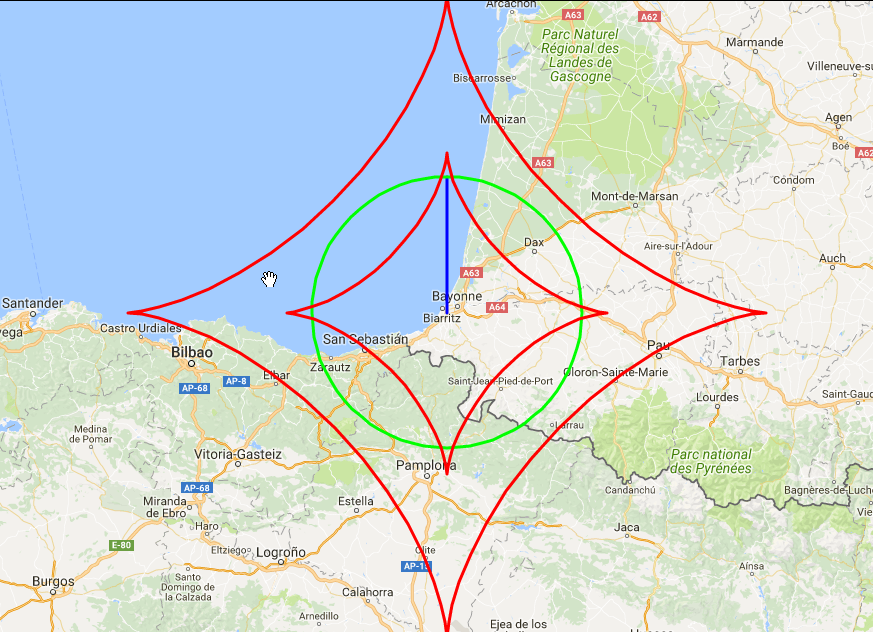
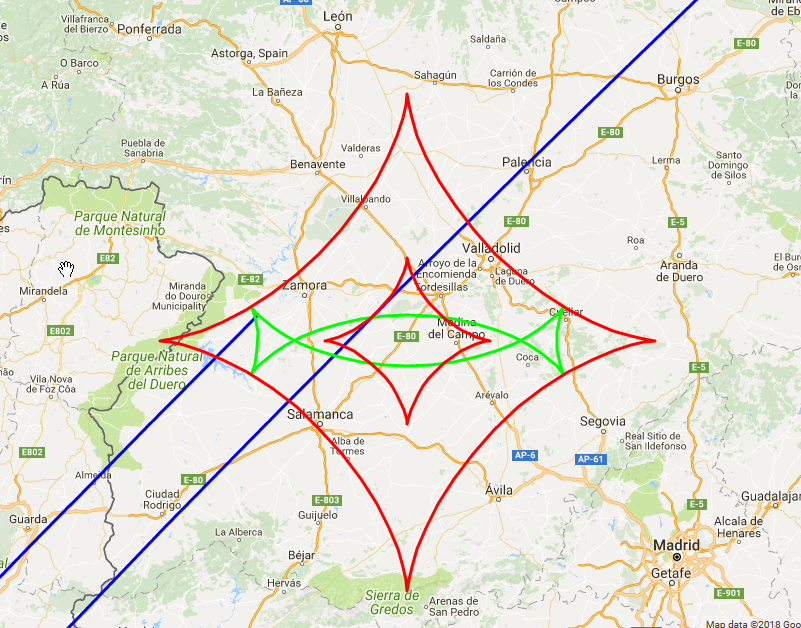
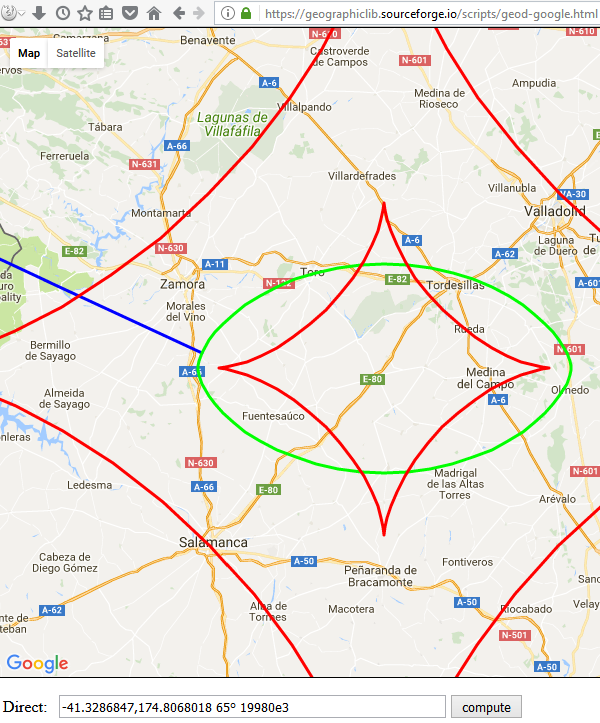
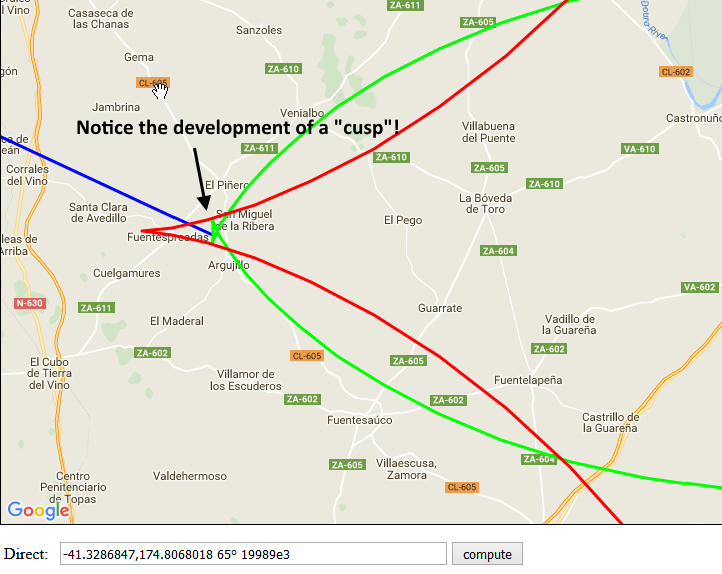
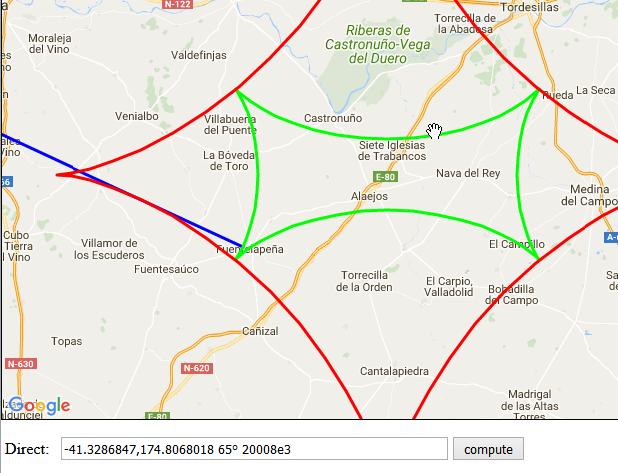
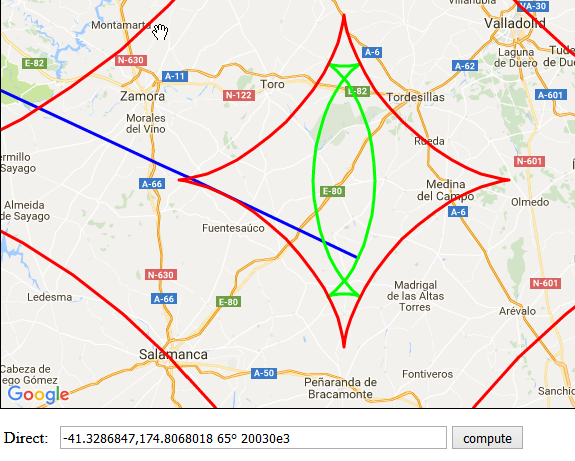
The envelope is formed by the light blue lines which are geodesics emanating from a single point on the other side of the ellipsoid (the flattening of the ellipsoid is 1/10). If this were a sphere, all the geodesics would go through the antipodal point and the envelope would collapse to a point. The green curves are geodesic circles and the red curve is the cut locus which is a portion of the circle of latitude through the antipodal point.
This just shows the first envelope obtained by letting the geodesic go slightly more than 1/2 way round the ellipsoid. Bigger envelopes are generated if the geodesics go slight more than 1 time around (envelope is then centered on the originating point), or 1-1/2 times around (centered on the antipodal point), etc.
This code presumes that you have installed MATLAB Central packge 50605. I'm sorry that it's not very pretty; it was just intended to "get the job done".
function geod_envelope
  thick=1;
  thin=0.3;
  red=[179,27,27]/255;
  white=[1,1,1];
  black=[0,0,0];
  blue=[0,19,56]/100;
  green=[9,45,27]/100;
  xsize=4*0.66;ysize=4*0.66;
  name='geod-envelope';

  figure(1);

  a = 1;
  r = 10;
  ell = [a, flat2ecc(1/r)];
  lat1=-30;
  lon1=0;
  lat0=-lat1;lon0=180;
  hold off;
  for azi1=[-180:3:180],
    [lat,lon] = geodreckon(lat1,lon1,[120:2:240]',azi1,ell,1);
    xyz=proj([lat,lon],lat0,lon0,a,r);
    xyf=frontx(xyz);
    plot(xyf(:,1),xyf(:,2),'-',...
         'LineWidth',thin,'Color',0.3*blue+0.7*white);
    if azi1 == -180,
      hold on;
    end
  end

  [latc,lonc,~, ~, ~, ~, ~, s12c] = ...
     geodreckon(lat1,lon1,180,90,ell,1);
  loncut=180+[-8:8]'/8*(180-lonc);
  latcut=latc+0*loncut;
  xyz=proj([latcut,loncut],lat0,lon0,a,r);
  xyf=frontx(xyz);
  plot(xyf(:,1),xyf(:,2),'-','LineWidth',thick,'Color',red);
  s12d = geoddistance(lat1,lon1,-lat1,lon1+180,ell);
  ds=(s12d-s12c)/2;
  for s=[0:6],
    s12=s12c+ds*s;
    [lat,lon] = geodreckon(lat1,lon1,s12,[-180:2:180]',ell);
    xyz=proj([lat,lon],lat0,lon0,a,r);
    xyf=frontx(xyz);
    plot(xyf(:,1),xyf(:,2),'-','Color',green);
  end

  hold off;

  axis image;
  axis(0.25*[-1,1,-1.109,0.891]);
  axis off;
end

function xyz = proj(ll, lat0, lon0, a, f)
  %proj convert ll to ortho from pov of lat0 lon0
  if f>1
    f=1/f;
  end
  e2=f*(2-f);
  e2m=(1-f)^2;
  degree=pi/180;
  phi=[ll(:,1);lat0]*degree;
  lam=[ll(:,2);lon0]*degree;
  sphi=sin(phi);
  cphi=cos(phi);
  n = a ./ sqrt(1 - e2 * sphi.^2);
  slam = sin(lam);
  clam = cos(lam);
  z = e2m * n .* sphi;
  x = n .* cphi;
  y = x .* slam;
  x = x .* clam;
  east0 = [-slam(end)          ;  clam(end)          ; 0        ];
  north0 =[-clam(end)*sphi(end); -slam(end)*sphi(end); cphi(end)];
  up  =   [ clam    .*cphi     ,  slam    .*cphi     , sphi     ];
  up0 =   up(end,:)';

  pts = [x(1:end-1)-x(end), y(1:end-1)-y(end), z(1:end-1)-z(end)];
  x = pts * east0;
  y = pts * north0;
  z = up(1:end-1,:) * up0;
  xyz = [x, y, z];
end

function xy = frontx(xyz),
  c=xyz(:,3)>=-0.01;
  c=1+0./c;
  xy = [xyz(:,1).*c, xyz(:,2).*c];
end

