4

I am having great fun getting to grips with QGIS (fantastic). I have set myself a "project" to try to learn the techniques.

This project refers to 2 Layers (geographic areas for Telephone Exchanges in UK) - I was donated a shapefile. I am now trying to overlay with Cities/Towns/Village names. Pulled from a CSV from Ordnance Survey. The Names/symbols for the Places works fine, also. I need to set Scale Based visibility for the differing place types (Cities/Towns/villages and Hamlets).

My problem is this: When I check the Scale Dependent Visibility, my Labels disappear from view, regardless of any setting I put into Min/Max (I have put the max scale into the min and tried "Set to current canvas") yet once I apply the labels are gone - regardless of how much more I zoom in.

The other thing I notice is that the max Scale 1:1000000 is way lower (too zoomed in) for a normal view - I'm not sure if this is related to the problem above, as the Min/Max boxes only seem to accept scales within the range in the "Scale" Box. I tried adding a larger value in Settings, but this is not possible. I also considered re-setting the Scale of the project, but cannot find a method to achieve this.

1
  • 2
    Note that "maximum scale" means "most zoomed in" and "minimum scale" means "most zoomed out". If you mixed them up, you probably have a min scale that's larger than the max scale. In that case the labels won't show up at any scale.
    – csk
    Commented Aug 16, 2019 at 20:13

1 Answer 1

2

Bear in mind that the project itself doesn't have a scale (unless you specify preset scales in the project properties). The scale dependent visibility applies everytime the view is rendered, so zooming in and out in the map view will trigger the visibility rules. Scale is only an indication of the ratio at which the map view is rendered.

Of course, if you are making a map (or many maps) in a print layout at set scales, you need to plan your visibilities accordingly but the scales are set for each map view item in a layout, not per project.

The important thing to remember is that you should always consider the scale as a ratio, dividing the numerator by the denominator (for example 1 : 1 000 000). The larger the denominator, the smaller the scale. The minimum scale should be the largest denominator you want your label to be visible at (smallest ratio) and the maximum scale should be the smallest denominator (largest ratio).

If, for example, you made a smaller scale map at 1 : 100 000 and only want city names to appear but then in a 1 : 10 000 inset want hamlet names to also appear, you could leave city names appear at all scales but set the hamlet names' minimum visibility scale to 1 : 11 000. As soon as the zoom level in the map view will go over the 1 : 11 000 threshold, the labels will disappear.

edit

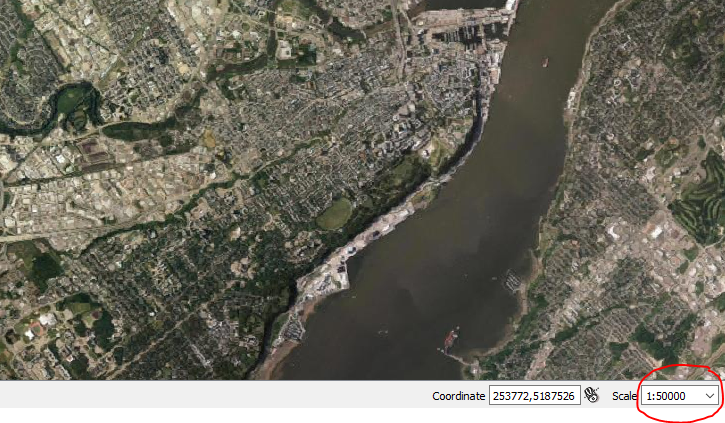
As an example, here's what the scale for a city-level visualization should look like: enter image description here

If you need to render at 1 : 100 000 000 to see the whole city, there's something wrong with your data.

2
  • Thanks, but my fundamental point is that the smallest scale that I can get anything to appear is so far zoomed in to make it of no benefit at at. What I wanted to be able to do was give visibility to Cities, the Towns, then Villages, then Hamlets - but, because the largest scale it will take is 100,000,000 then this is so small that it is where I would be wanting to display the Hamlets, not Cities... Ideally, I would be wanting to increment the ratio by a further 1,000,000 or so.
    – JOLT8631
    Commented Aug 18, 2019 at 6:54
  • 1 : 100 000 000 is enough to see the entire world. There is something wrong with your scales or you scaled the data up inadvertently.
    – Gabriel
    Commented Aug 19, 2019 at 11:27

Your Answer

By clicking “Post Your Answer”, you agree to our terms of service and acknowledge you have read our privacy policy.

Not the answer you're looking for? Browse other questions tagged or ask your own question.