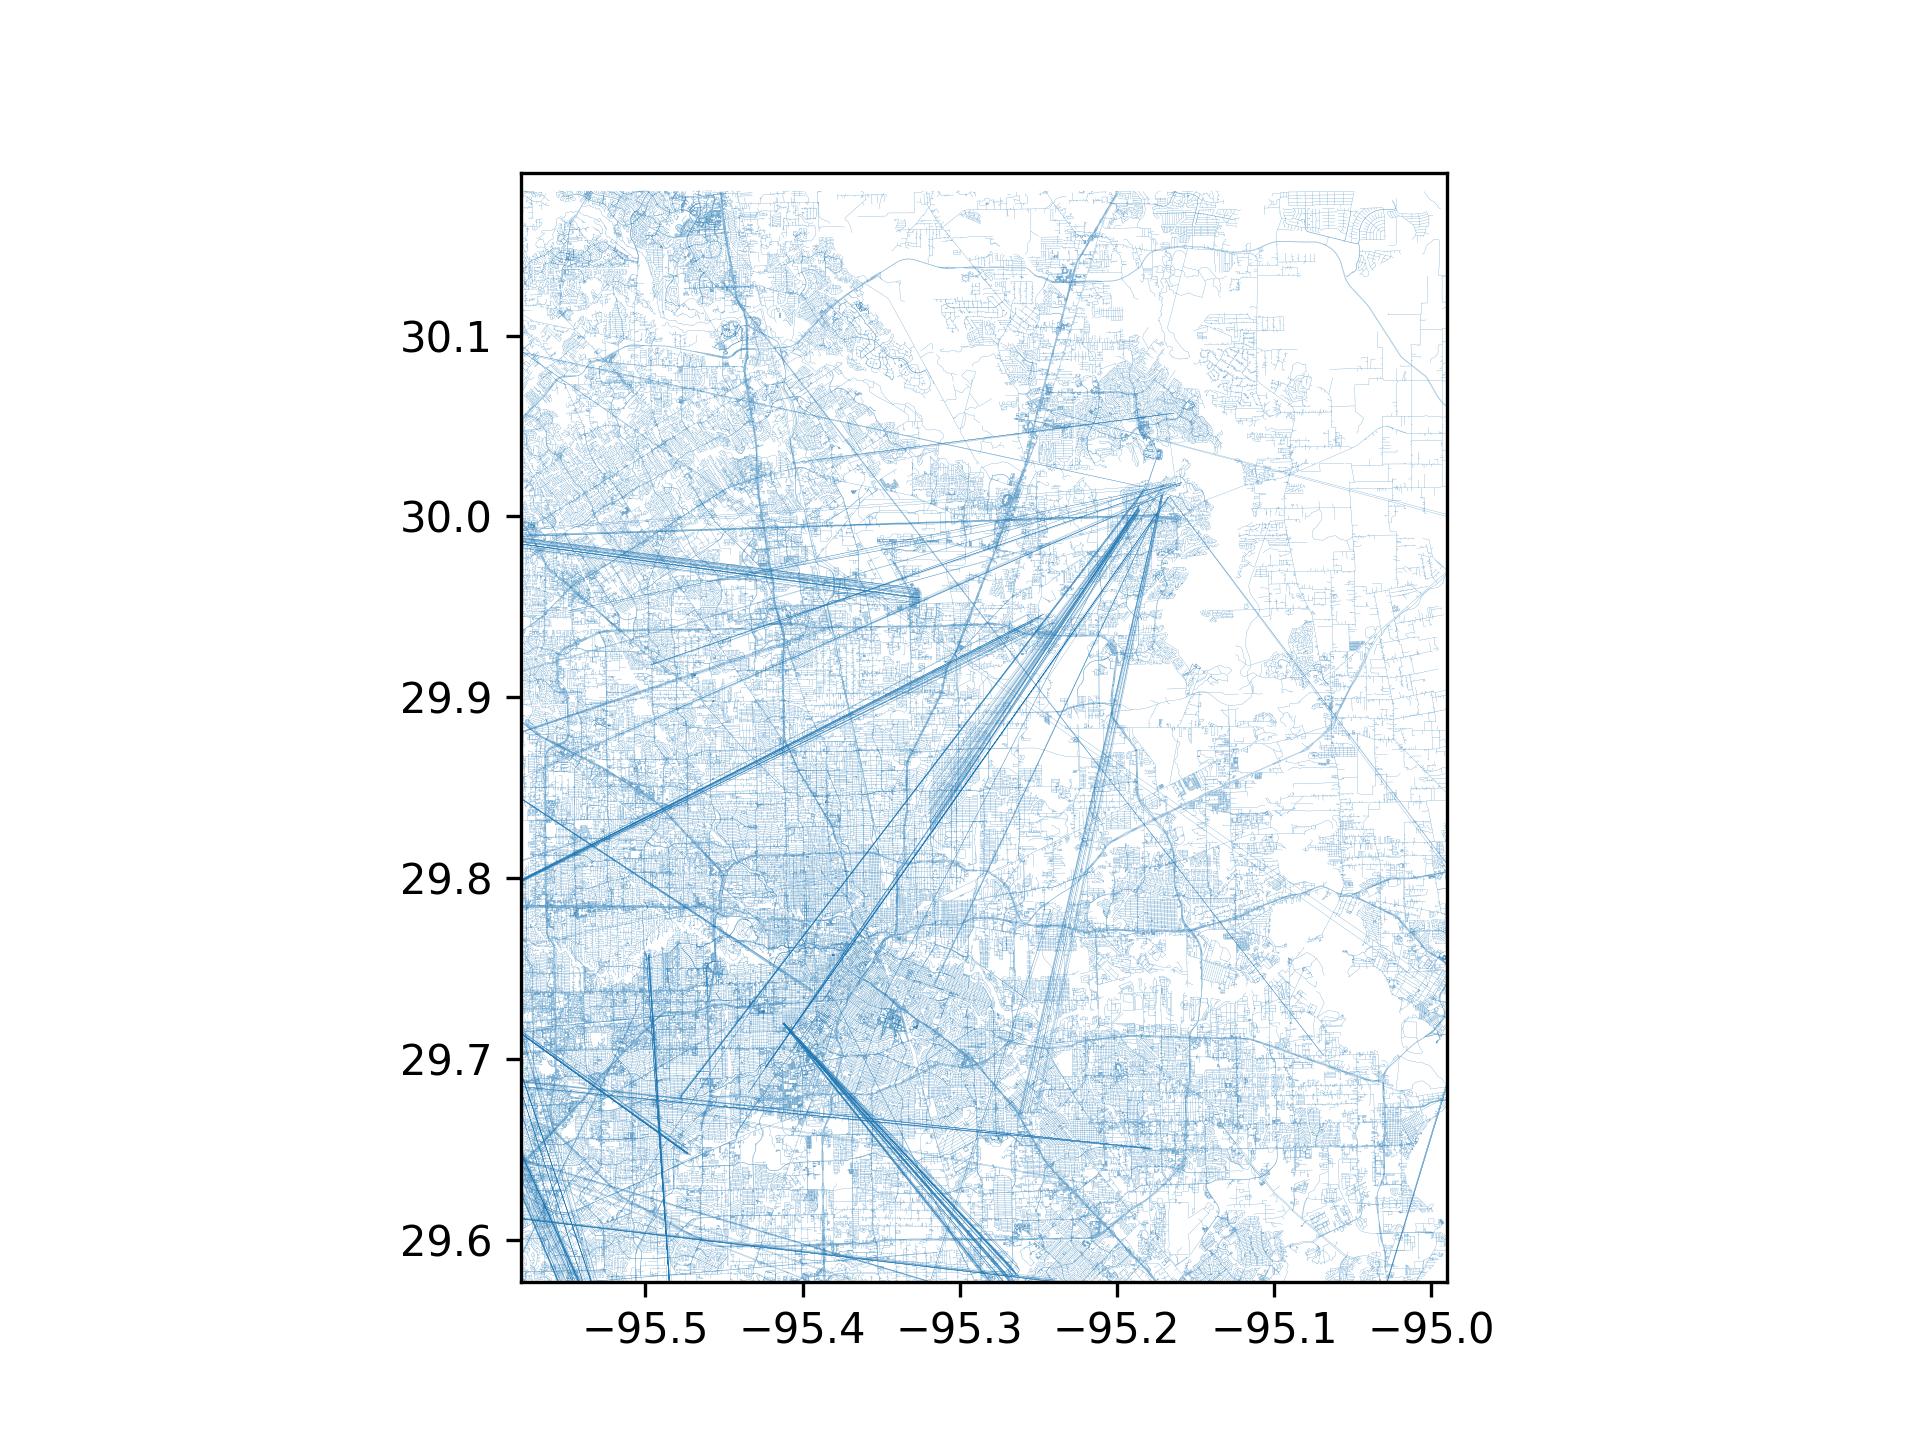
I downloaded some shapefiles of Houston from the Open Maps data using this tool. I am plotting the roads and I have a weird thing happening. Most of the lines are correct, but there are clearly several erroneous lines that are drawing long streaks across the map.

How can I identify these lines and remove them from the shapefile?
Here is the code I used to plot the thing.
import geopandas
import matplotlib.pyplot as plt

fname = 'planet_-96.09,29.269_-94.616,30.18-shp/shape/roads.shp'

fig = plt.figure(dpi=300)
ax = plt.subplot(1, 1, 1)

lat_0 = -95.579
lat_1 = -94.99
lon_0 = 29.577
lon_1 = 30.19

ax.set_xlim([lat_0, lat_1])
ax.set_ylim([lon_0, lon_1])

roads = geopandas.read_file(fname)

roads.plot(ax=ax, lw=.05)

plt.savefig('houston.png')
