0

I downloaded some shapefiles of Houston from the Open Maps data using this tool. I am plotting the roads and I have a weird thing happening. Most of the lines are correct, but there are clearly several erroneous lines that are drawing long streaks across the map. enter image description here
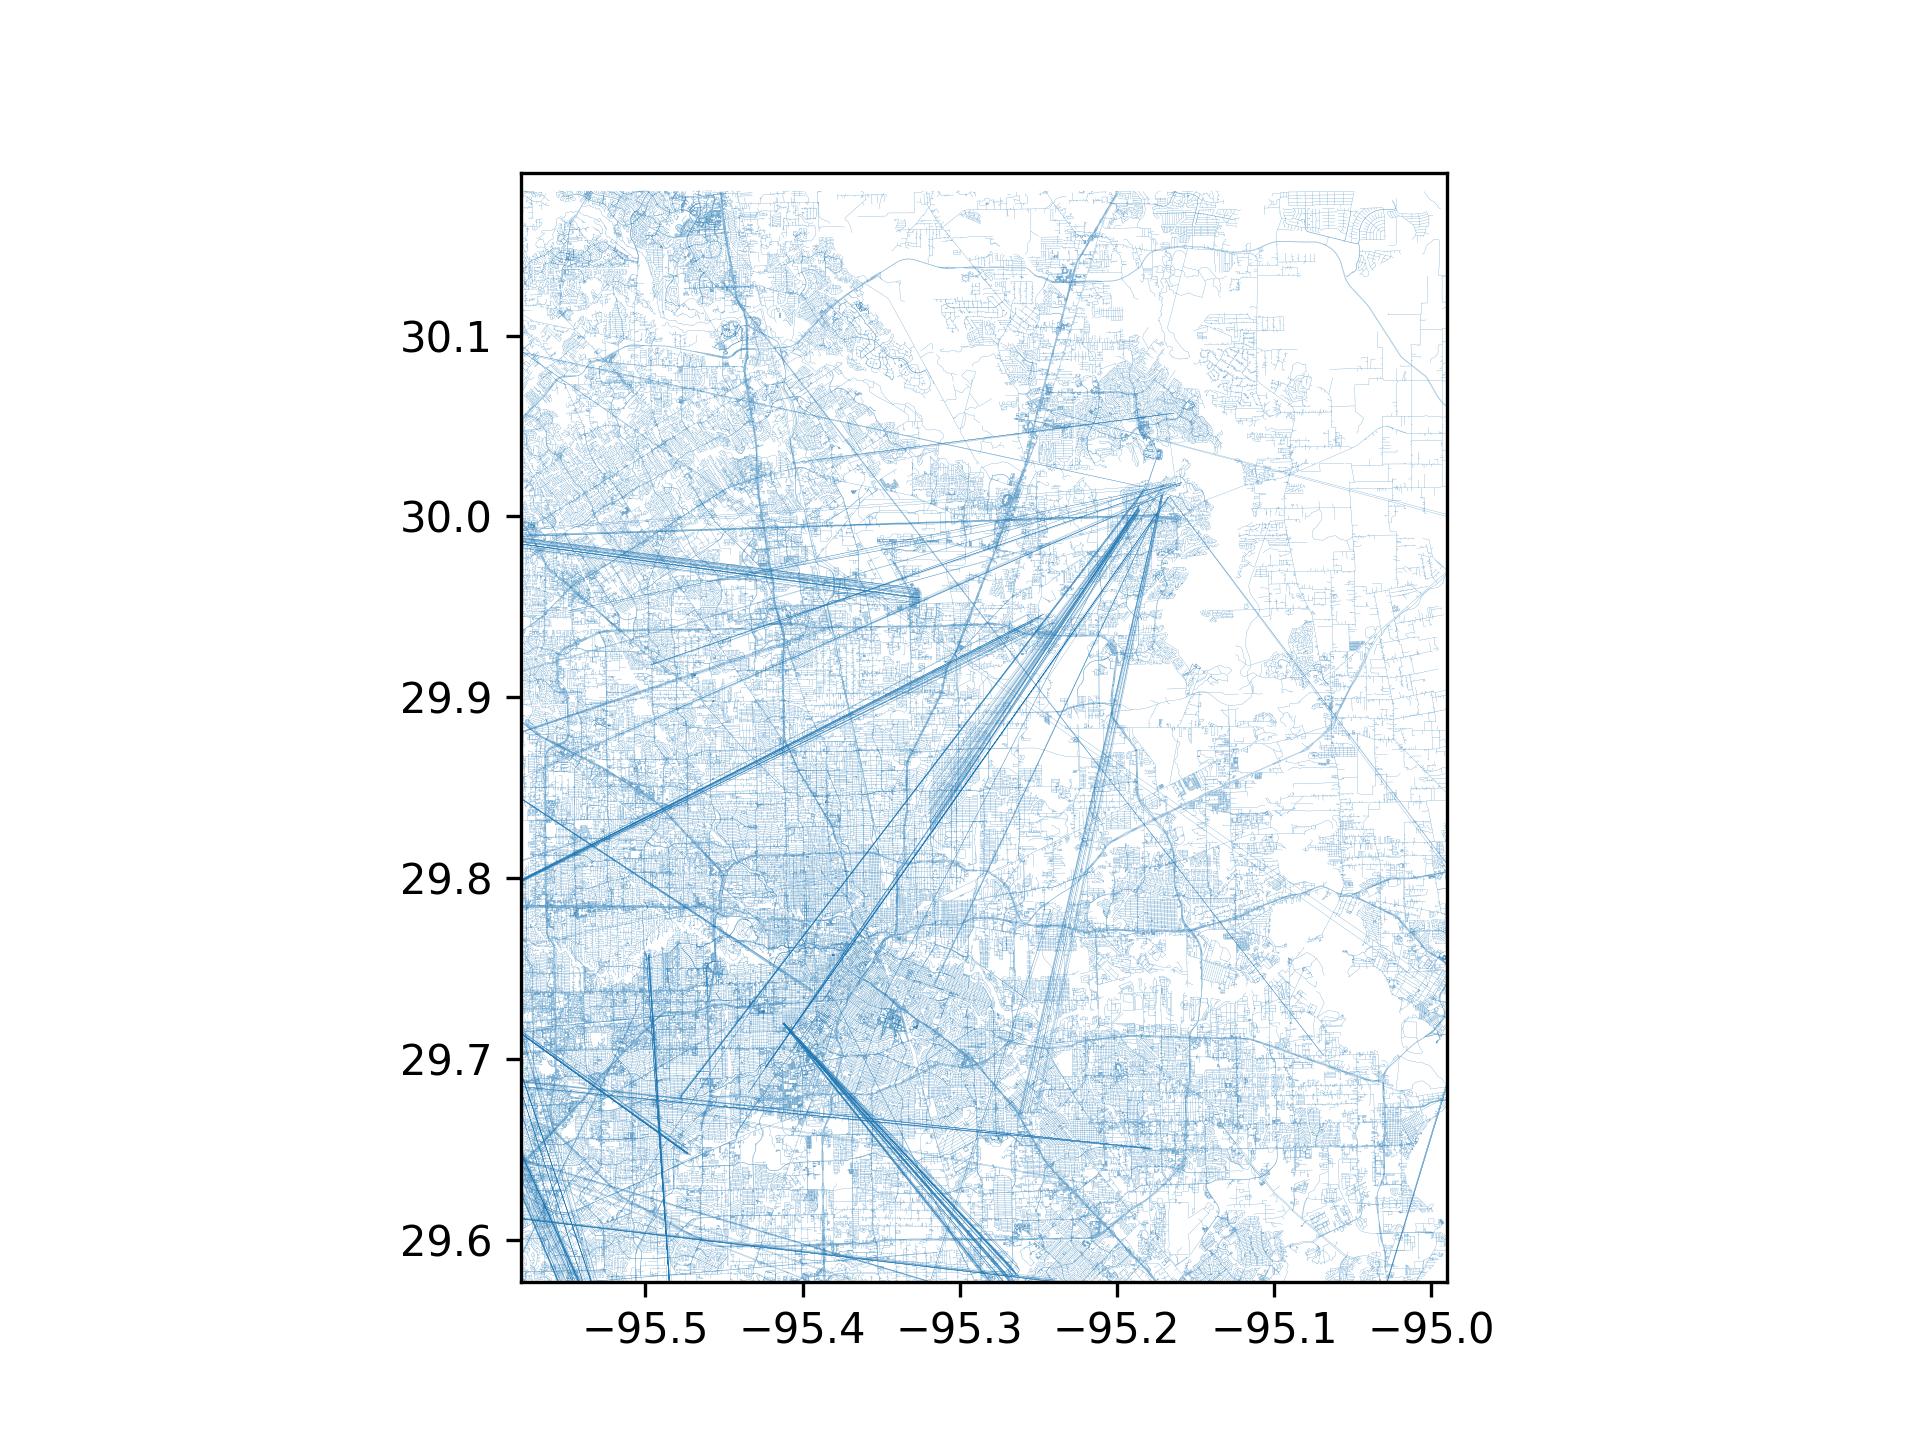
How can I identify these lines and remove them from the shapefile?

Here is the code I used to plot the thing.

import geopandas
import matplotlib.pyplot as plt

fname = 'planet_-96.09,29.269_-94.616,30.18-shp/shape/roads.shp'

fig = plt.figure(dpi=300)
ax = plt.subplot(1, 1, 1)

lat_0 = -95.579
lat_1 = -94.99
lon_0 = 29.577
lon_1 = 30.19

ax.set_xlim([lat_0, lat_1])
ax.set_ylim([lon_0, lon_1])

roads = geopandas.read_file(fname)

roads.plot(ax=ax, lw=.05)

plt.savefig('houston.png')

1 Answer 1

2

Based on the plot you have shared, it looks like the problematic lines you want to get rid of are the ones that are straight containing just two coordinates. If this assumption is correct, you could remove them from your geodataframe following these steps:

First, create a function that counts the number of coordinates or vertices for each line. Something like this should do the trick:

  def get_num_vertices(row):
    if row.geometry.type.startswith("Multi"):
        num_vertices = 0
        for part in row.geometry:
          num_vertices += len(part.coords)      
    else:
      num_vertices = len(row.geometry.coords)
    return num_vertices

Secondly, drop all rows with less than two coordinates/vertices (and any other filter like geometry.length greater than...).

roads['num_vertices'] = roads.apply(lambda x: get_num_vertices(x), axis=1)
roads_filtered = roads.loc[roads.num_vertices > 2]
5
  • neat. I'll try it out. Thank you for your time
    – K. Shores
    Commented Jul 6, 2020 at 13:24
  • Your welcome, remember to mark as solved if it fixes your problem. Commented Jul 6, 2020 at 13:25
  • It did not. I downloaded a shapefile from the city of Houston that worked for me.
    – K. Shores
    Commented Jul 6, 2020 at 22:19
  • Why did not work? Did you get any error? Commented Jul 7, 2020 at 5:51
  • Nope. The bad lines must have had more than two points. It turns out that the city of Houston provides shapefiles for the roads anyways (cohgis-mycity.opendata.arcgis.com/datasets/…). Those files don't have anything wrong with them (at least not like those huge streaks).
    – K. Shores
    Commented Jul 7, 2020 at 11:25

Your Answer

By clicking “Post Your Answer”, you agree to our terms of service and acknowledge you have read our privacy policy.

Not the answer you're looking for? Browse other questions tagged or ask your own question.