5

I want to add to my vector file layers with some points to show animals occurrences in Germany for different years.

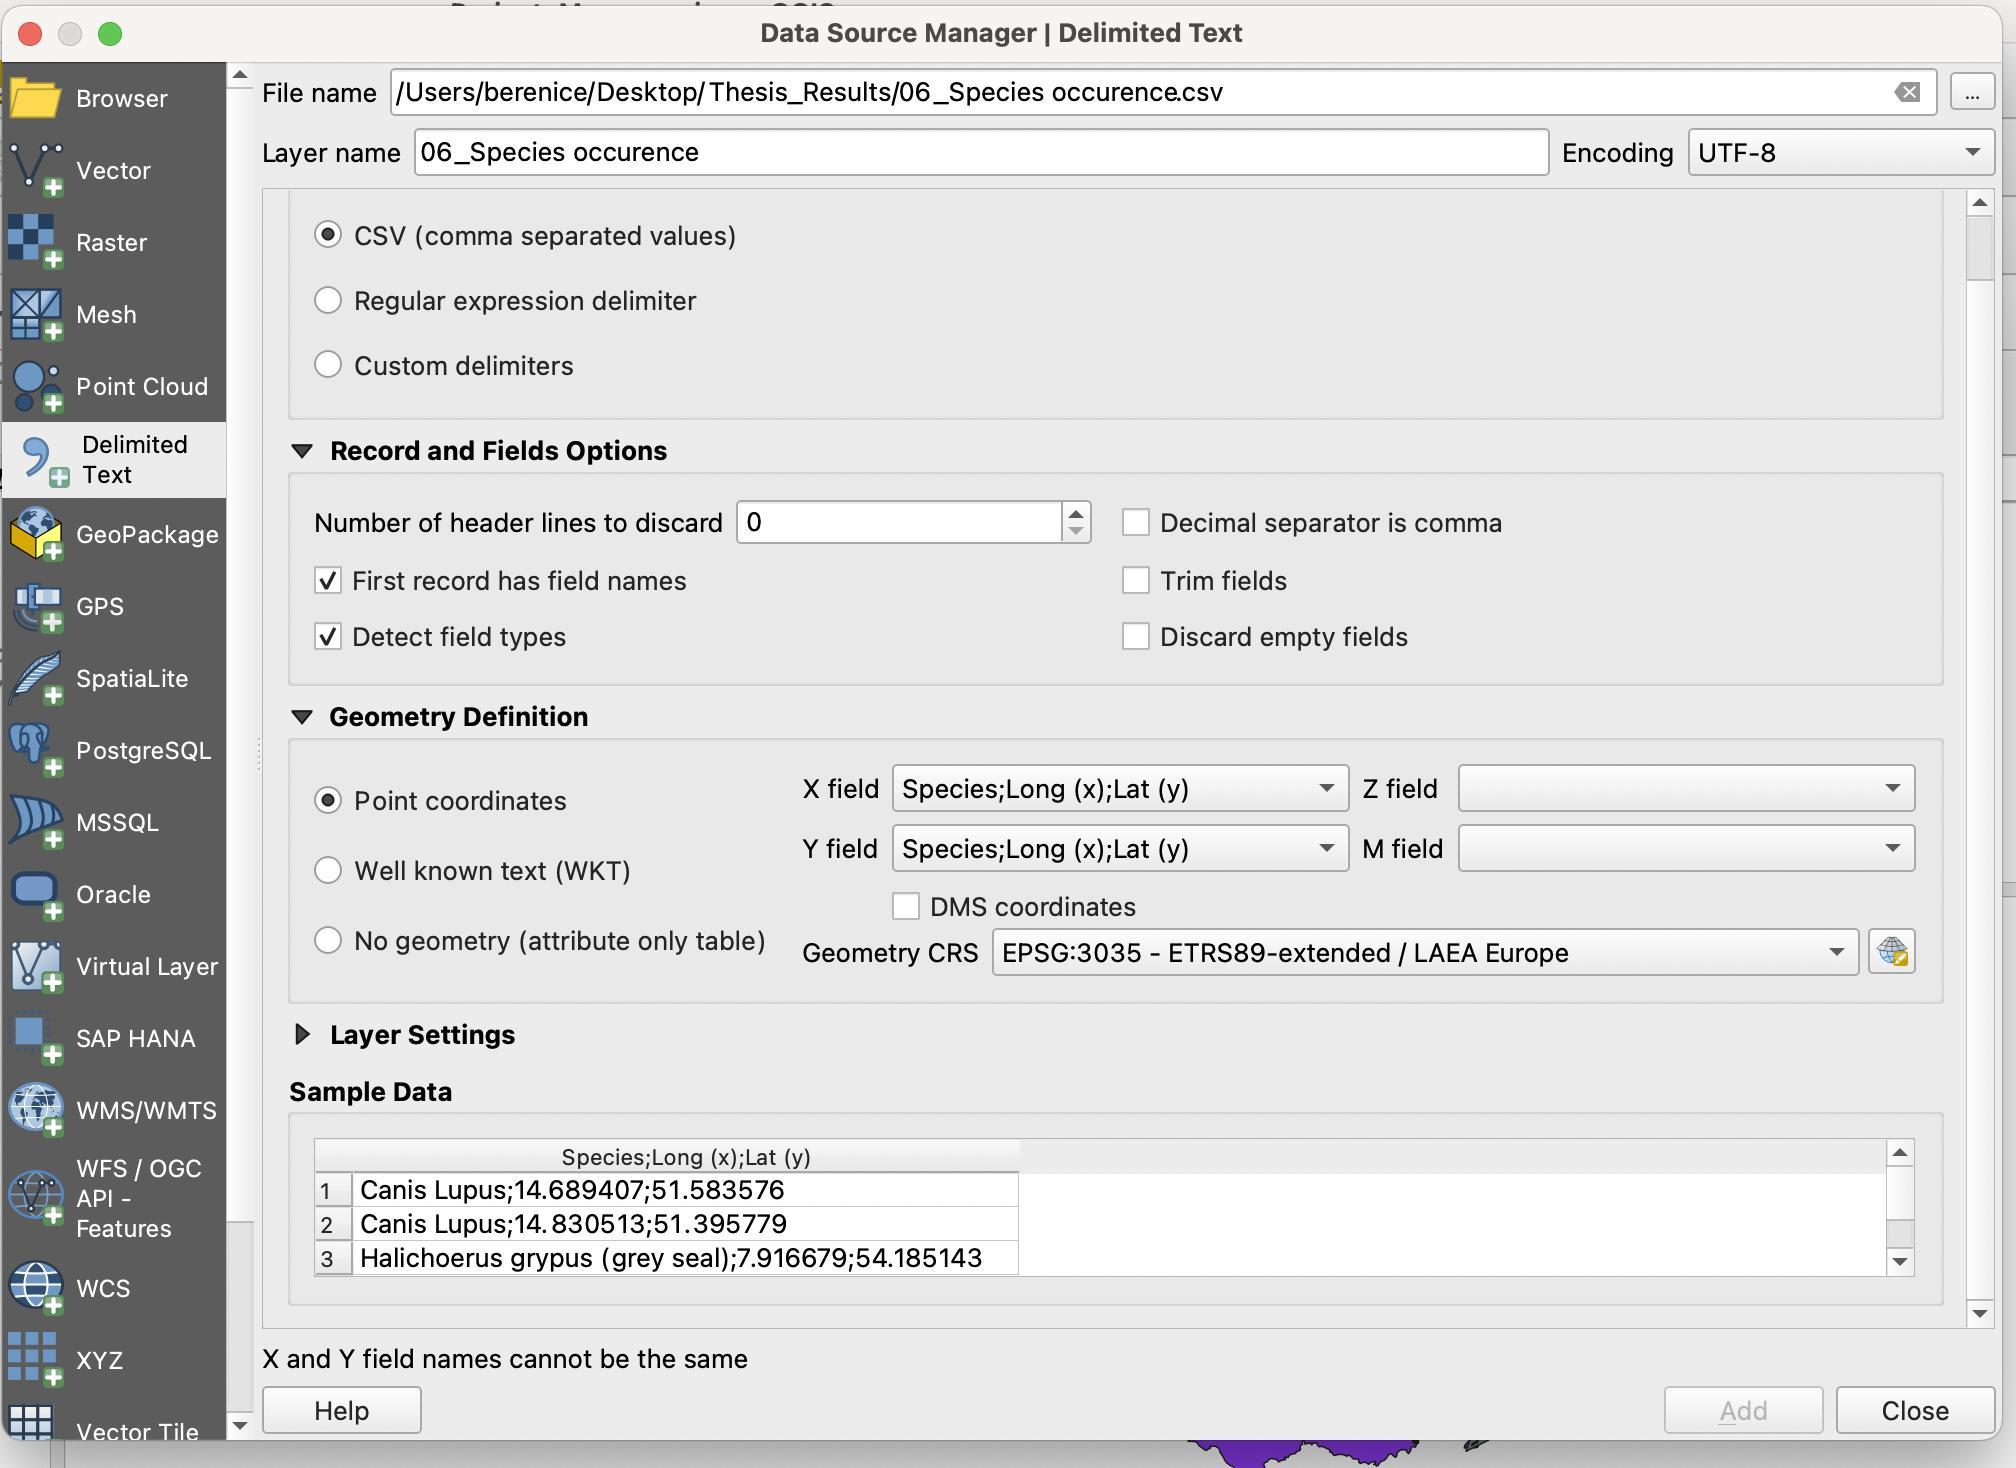
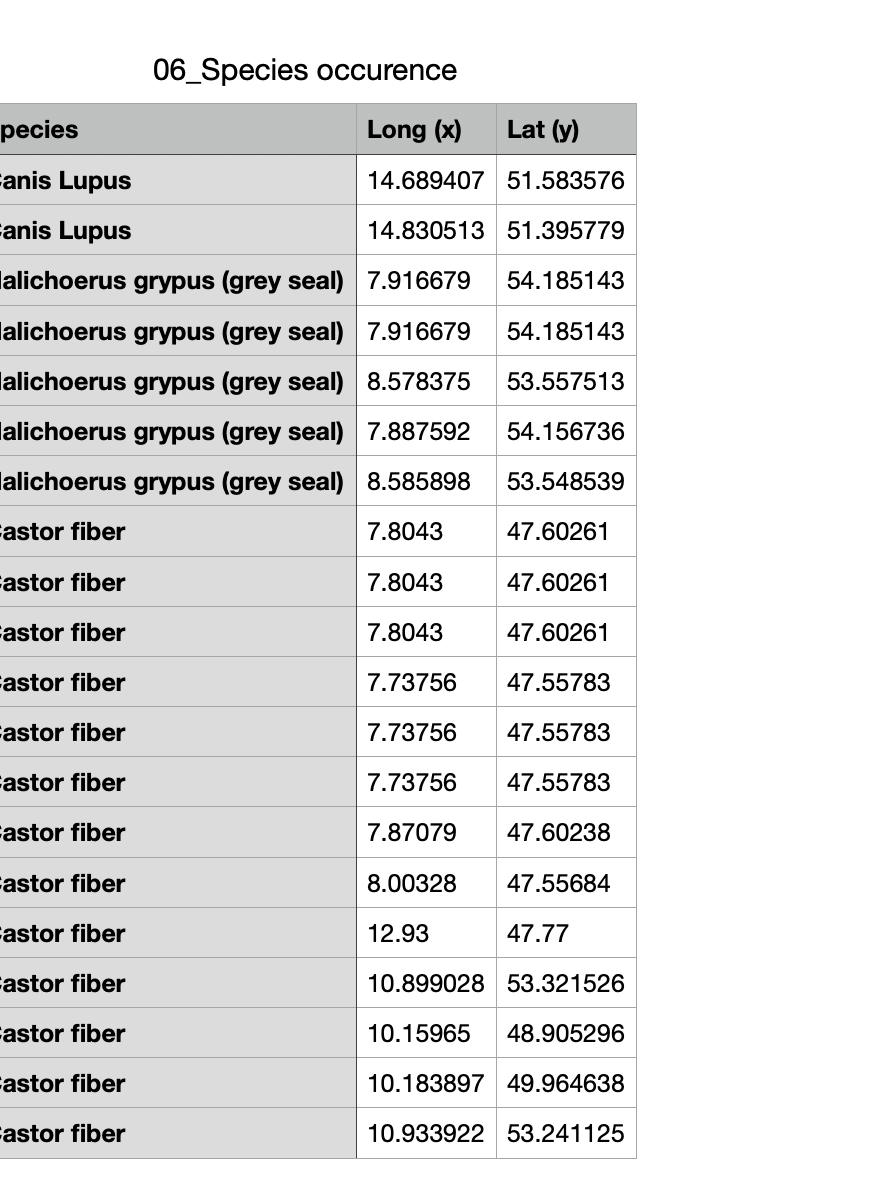
I have all the coordinates in a CSV file (see image attached) but when I want to charge it on QGIS (add layer "Data source manager/delimiter text") I actually can't.

Data Source Manger, delimited text

enter image description here

enter image description here

6
  • 11
    change it to custom delimiter and set it to ";" right now it tries to create breaks between columns with a "," which results in a single column with the name "Species;Long (x); Lat (y)".
    – Vincé
    Commented Mar 4, 2022 at 15:23
  • From your image, it seems QGIS fails to differenciate the fields (see "Y field" and "Y field"). Try telling it your separator is semi-colons and not commas. On another note, I am not 100% your field names can inclue spaces and brackets. I would avoid them.
    – ChloeG
    Commented Mar 4, 2022 at 15:24
  • 5
    The coordinates of EPSG:3035 are not decimal degrees but meters (northing/easting). If your coordinates are decimal degrees, then the CRS is not EPSG:3035
    – nmtoken
    Commented Mar 4, 2022 at 15:52
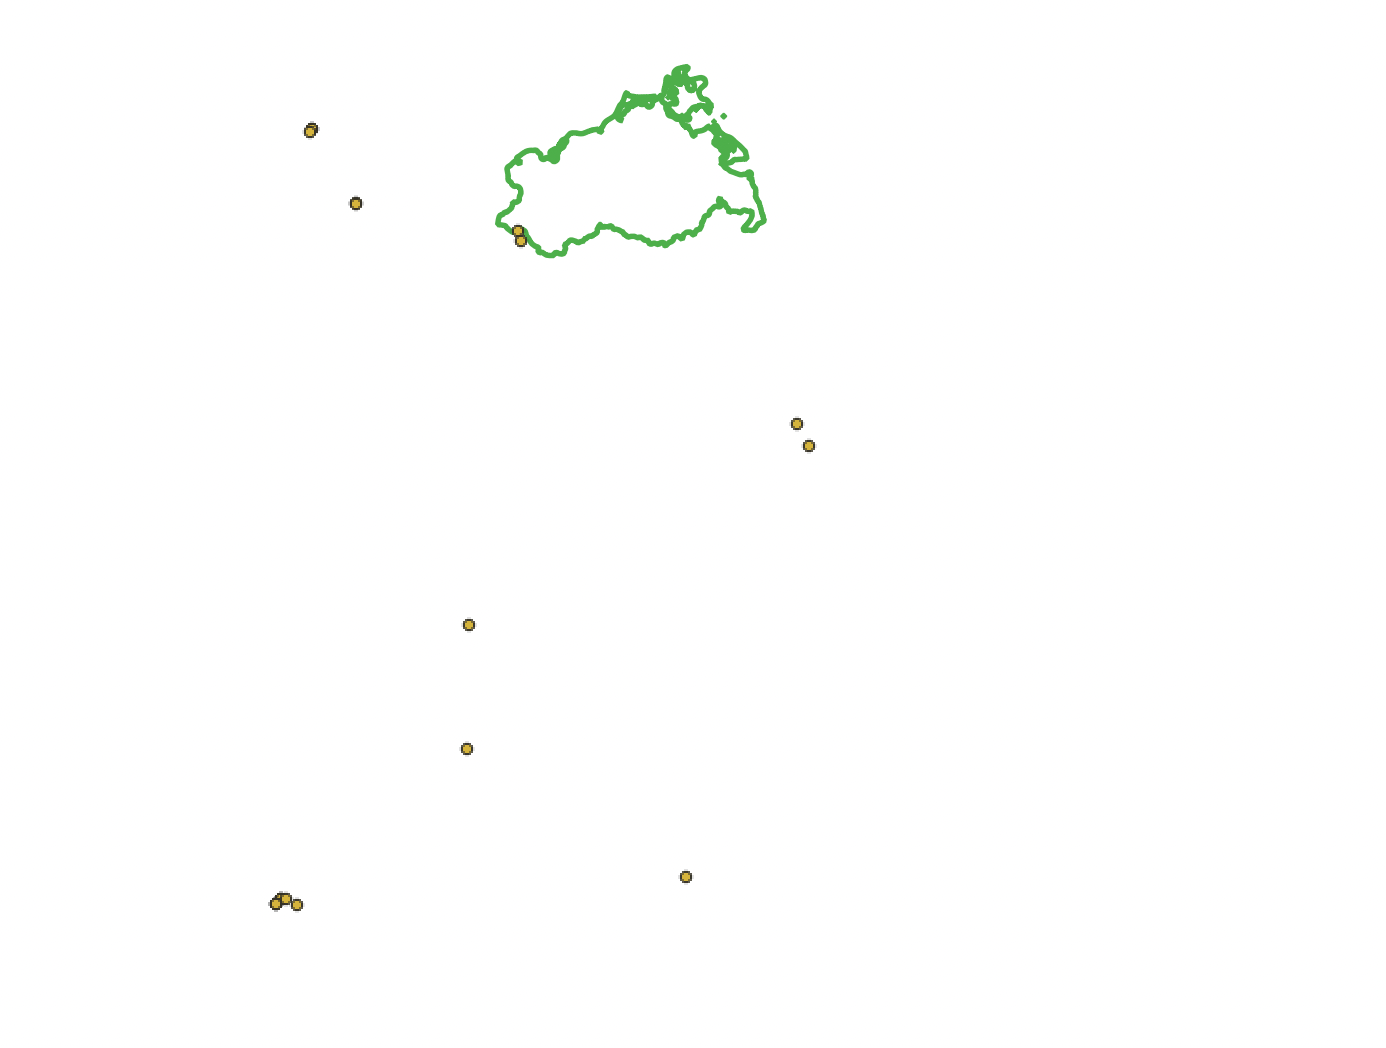
  • Thank you to all of you, I could charge my layer, however, my points do not appear on top of my already existing layers... (i.e. I want to see my species occurrences on the area I am looking at which is projected with CSR 30:35), do you know why? I added a screen capture for more details
    – Robagb
    Commented Mar 7, 2022 at 8:59
  • 1
    As mentioned by @nmtoken your coordinates are expressed in decimal degrees. If I project your points using WGS 84 (EPSG: 4326), they are in Germany. Wolves in the East, seals on the coast or in the sea. You can later reproject your points to the desired CRS.
    – ChloeG
    Commented Mar 7, 2022 at 10:29

2 Answers 2

3

I copied the first 7 points from your table in an Excel file. The first thing I did was setting the fields as numeric with 8 decimals (this avoids issues in ArcGIS, but I don't know if it is necessary in QGIS). I saved this file as a CSV:

Species;X;Y
Canis Lupus;14.68940700;51.39577900
Canis Lupus;14.83051300;51.39577900
Grey seal;7.91667900;54.18514300
Grey seal;8.57837500;53.55751300
Grey seal;7.88759200;54.15673600
Grey seal;8.58589800;53.54853900

Then I used the "Create points layer from table" tool from QGIS. As your coordinate values seemed to be in decimal degrees, I used the default WGS 84 (EPSG: 2436): Screen capture of the tool settings and result
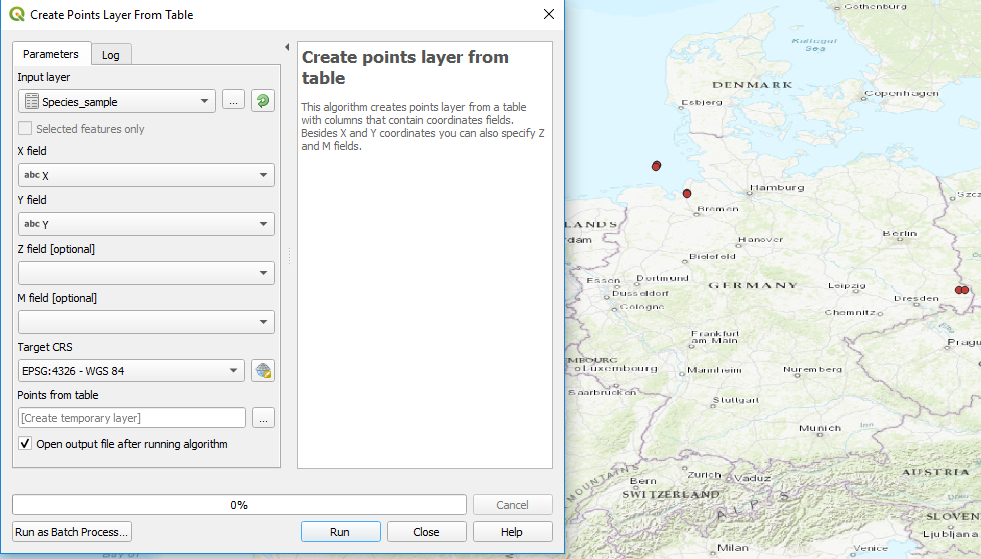
To reproject your data in the desired CRS, you can follow this tutorial.

1

I started by charging my csv file to add delimited text layer, I made sure to set it to ";" and I used the CRS WGS 84 (EPSG:4326) despite the fact than my project is in 3035.... I can see my points on the map :)

2
  • 1
    If you want to understand more about why your data can be visualised despite the CRS being different to the project, you can read here about "on-the-fly" transformation.
    – Matt
    Commented Mar 8, 2022 at 10:13
  • 1
    Thank you a lot!
    – Robagb
    Commented Mar 9, 2022 at 10:45

Your Answer

By clicking “Post Your Answer”, you agree to our terms of service and acknowledge you have read our privacy policy.

Not the answer you're looking for? Browse other questions tagged or ask your own question.