5

The resulting MultiLineString features of Service area (from point) and Service area (from layer) in QGIS usually contain several overlapping lines.

How can the length of the network covered by the service area be calculated?

I did not find a solution to remove all overlapping sections (see here). So I tried the following (for several overlapping service areas):

  1. Dissolve the service area(s)
  2. Add a minimal buffer to the service areas with Geometry by expression buffer($geometry,0.00001) (separate buffering necessary because of service area overlaps)
  3. Intersection of original network and minimal service area buffer

The resulting multiline features do not contain any overlaps (in case the aren't any overlaps in the original network) and the length can be calculated.

Thus, this works principally, but has two downsides: Due to the minimal buffer, the result is not very accurate. And due to the buffer calculation for each service area separately, there is an important performance issue when running this on lots of service areas in a complex network structure.

So how can this be resolved in a more accurate and performant way?

Please note: If you need test data to reproduce the issue and answer the question, just use Overpass Turbo and download OSM data from my test municipality by clicking on "Export" - or use any other municipality/region by changing the geocode area name.

I used this start point (link to GeoJSON file in my Nextcloud)

Find my whole test data with different models here

2
  • I used the Overpass query, but I am having trouble reproducing the problem. Can you give exact point coordinates and a service area size to use that will result in the self-overlapping sections?
    – Matt
    Commented Nov 24, 2023 at 16:15
  • Thanks for you attempt. See my edit at the bottom of the post. I used 250m or 500m service area. See the areas with problems here: gis.stackexchange.com/q/470597/52808
    – winnewoerp
    Commented Nov 24, 2023 at 16:37

2 Answers 2

5
+50

Solution, created as ready to use model

I created a model (see details below) that gets rid of all overlapping parts in the output of the service area algorithm. I successfully tested it with your data (using the model 6 to create the service area). se the model here to clean any overlapping parts from an input line layer:

https://drive.switch.ch/index.php/s/iMfAyHWLzHZYDAT

Your layer must be in a projected CRS which is appropriate for measurements, e.g. local UTM zones.

See also this Geopackage which contains two layers: service area created with your input and the output of my model with resulting cleaned line layer.

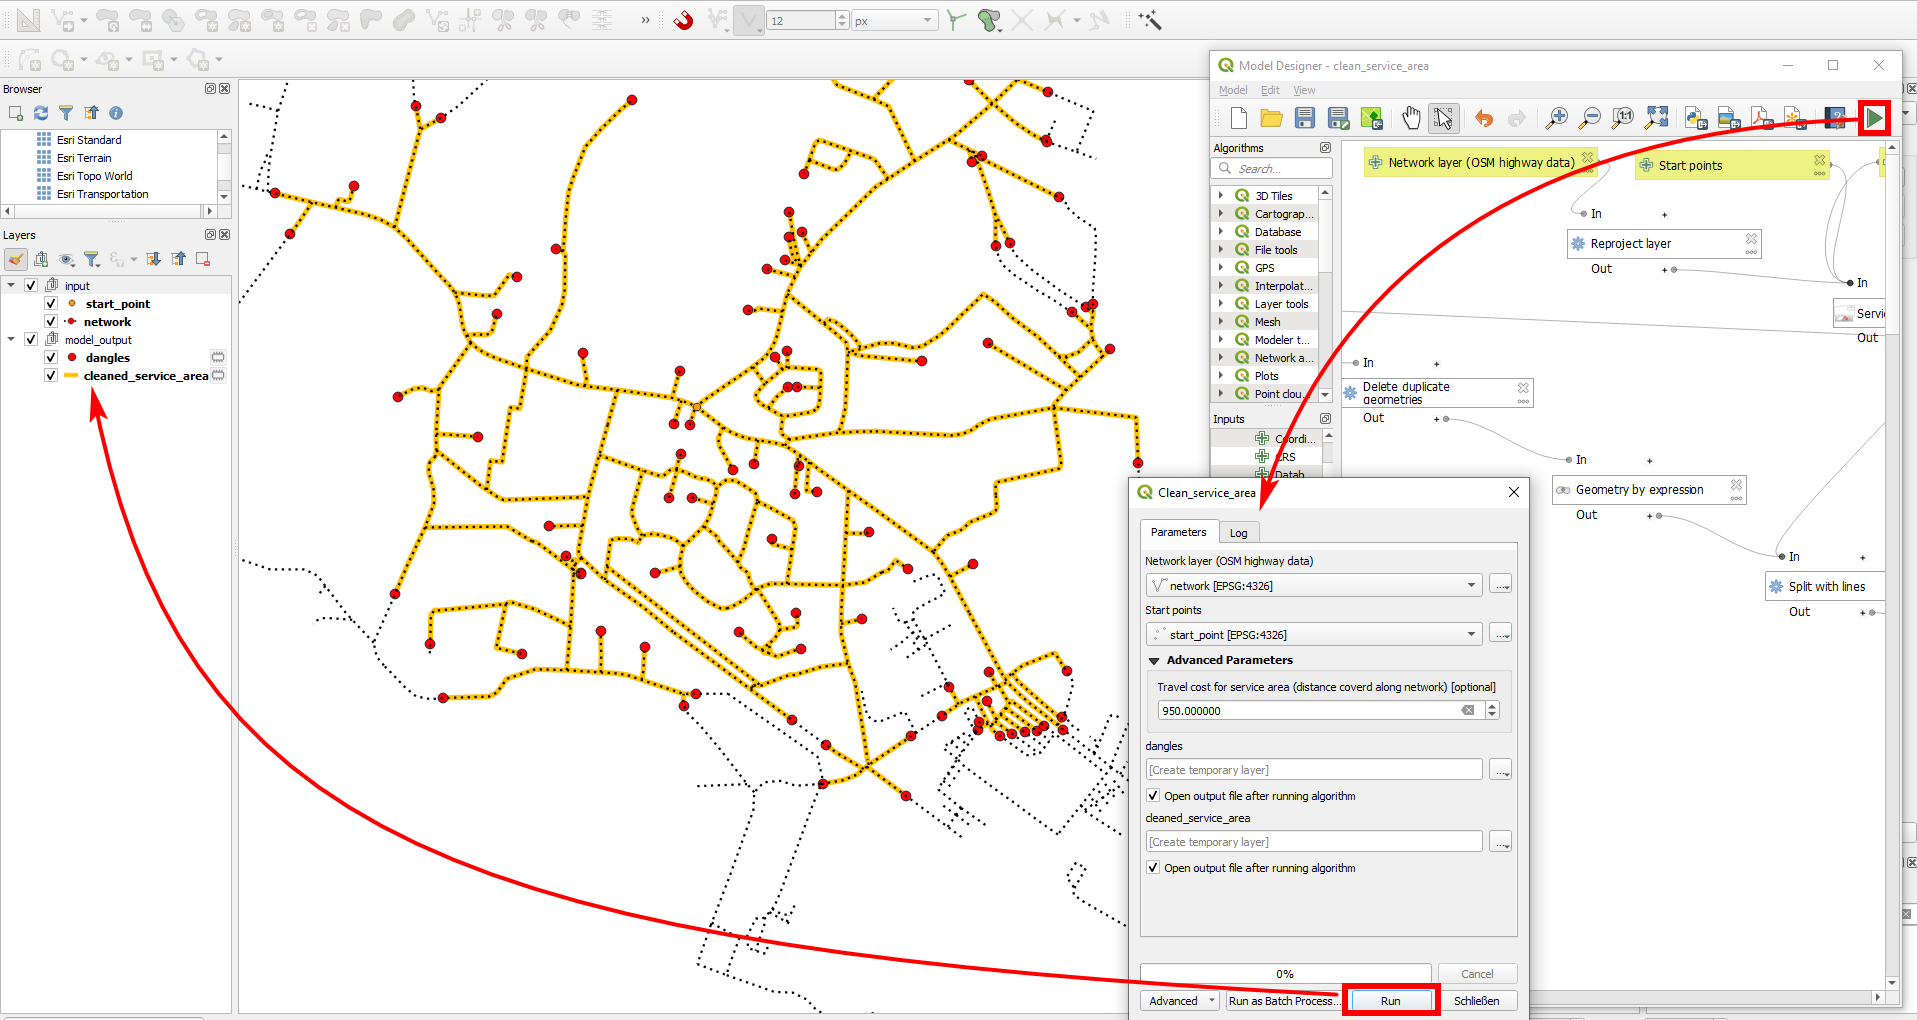
Based on this, I expanded the model so that you have as input the initial network layer and the start point and you can enter a travel cost (distance for service area) and you get a cleaned up service area line layer without any overlaps + point layer for dangles at the end of the service area (adapting this solution). Download this model from here.

The second model with output service area (yellow) + dangles (red) with initial network (black dotted line): enter image description here
The basic idea behind it

The algorithmic approach is: extract all vertices and split all lines at the vertices. Like this, overlapping lines will have the same vertices and are considered duplicates that you can delete.

The problem is how to get the same vertices for all overlapping lines. You get such overlappings as part of the service area output. Consider an Equilateral triangle defined by points A,B,C and with each side of a length of 2 (screenshot below). Run service area from start point A with:

  • travel cost of 2: Result is two lines: A to B and A to C.

  • travel cost of 3: both lines will be extended on the connection B/C and their ends meet exactly in the middel between B and C.

  • travel cost of 4: first line runs from A to B to C, second line from A to C to B. So C to B and B to C will be covered twice.

  • travel cost of 5: 1st line (blue): A to B to C to the middle between C and A; second line (red): A to C to B to middle between B and A, see image:
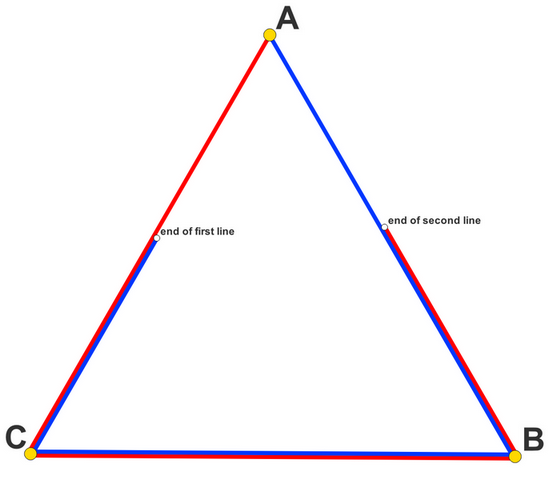
    enter image description here

You see that the white dots are the end-points of the red and blue lines. However, where one line has an end-point, the other one has no vertex. So to begin with, you must add vertices to the lines where other (overlapping) lines have vertices.

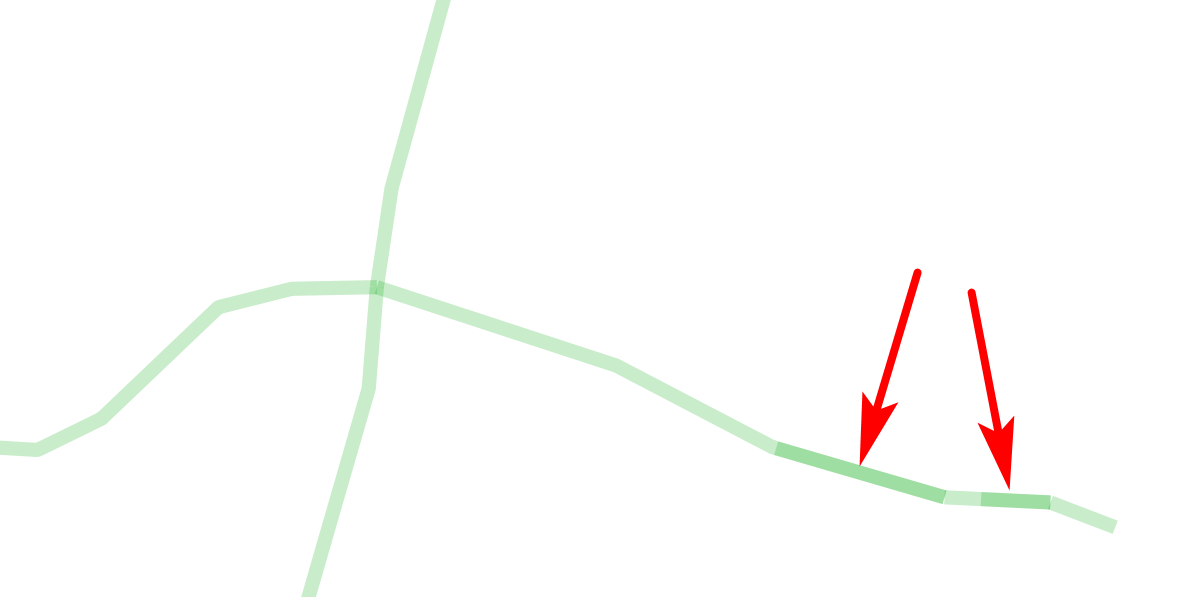
Initial service area with some segments as duplicates, visible when you set a thik line style with transparent color: where lines are darker, you have two or more overlapping lines: enter image description here
Solution explained step by step

Image of the model, described step by step in what follows: enter image description here
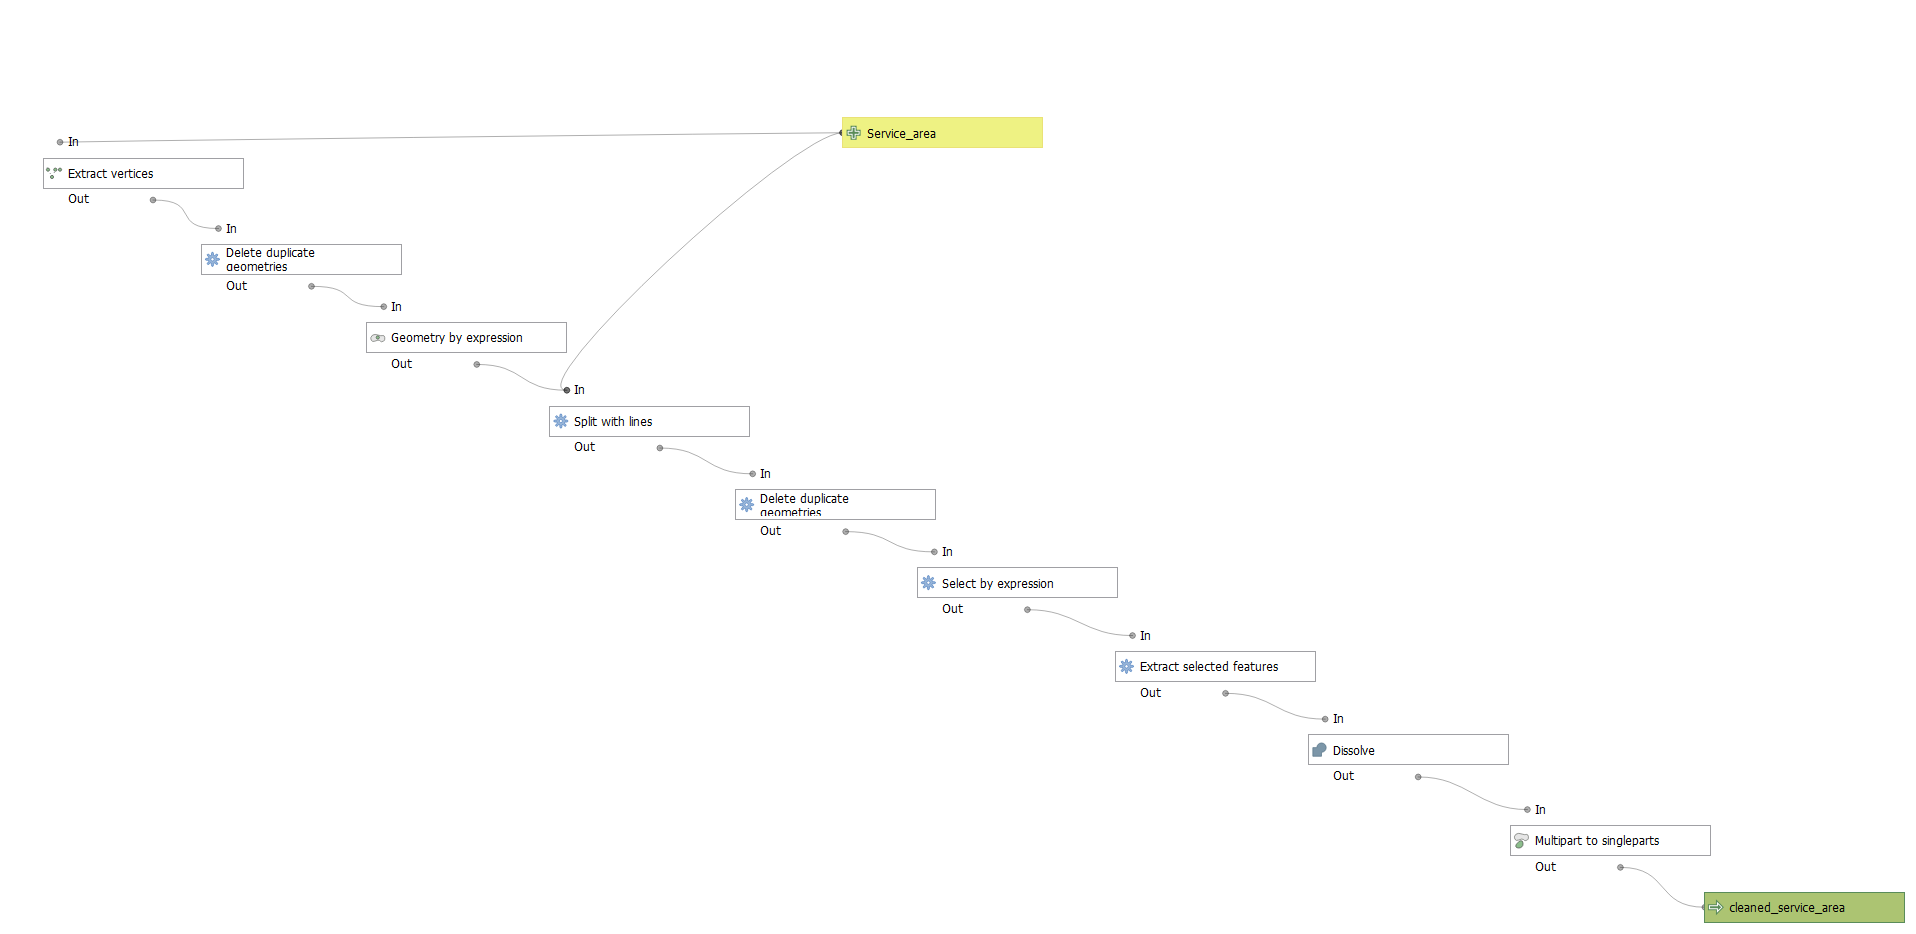
  1. Extract vertices.

  2. Delete duplicate geometries (vertices)

  3. Convert the remaining vertices to small, auxiliary lines using this solution (skip step 1: dissolve; in the expression in step 2, replace Dissolved by the name of your service area layer)

  4. Split the lines: split the service area with the auxiliary lines from step 3.

  5. Delete duplicate geometries.

  6. By now, most duplicates will be deleted. There remain some lines with (almost) identical geometries that differ only in line direction: start- and end point are switched (line 1 is A to B, line 2 is B to A). The tricky part is now to identify these pairs and to select only one of them to be deleted. To do so, use Select by Expression with this expression (explanation below), then delete the selected features:

$id > 
array_sum(
    array_foreach (
        overlay_nearest (@layer, $id,limit:=8),
        if (
            intersects (
                buffer (
                    centroid(
                        geometry (
                            get_feature_by_id (@layer, @element)
                        )
                    ),
                    0.000000001
                ),
                $geometry
            ),
            @element,
            ''
        )
    )
)

How the expression works: for each line get the centroid of the nearest few neighboring lines and create a very small buffer around these centroids. Then check if any of these buffers intersects with the current line: if so, get the id of the line with the intersecting buffer and check if this id is smaller then the id of the current line. Like this, you identify identical lines that differ only in line direction, but select just one of them.


Optional

  1. You may want to dissolve the result and convert multipart to single parts to get get a cleaner result with less features/one feature per "branch".
8
  • 1
    Thank you for the good and detailed explanations! This is very useful to understand why there are lots of overlaps in the service area. I tried to run your model using my test data and unfortunately I had a very strange result, only very short sections of some edges.
    – winnewoerp
    Commented Nov 25, 2023 at 7:38
  • 1
    See here for the result I got: tinyurl.com/3dhn34ur
    – winnewoerp
    Commented Nov 25, 2023 at 7:39
  • 1
    Your answer is definitely worth the bounty, even though I accepted my own one now. :)
    – winnewoerp
    Commented Nov 25, 2023 at 8:15
  • Ok. Can you share the exact input you used to get your strange result? Will be able to test later
    – Babel
    Commented Nov 25, 2023 at 8:39
  • Sure. Updated version of service_area_cleanup.qgz (see project data link at the end of the question).
    – winnewoerp
    Commented Nov 25, 2023 at 9:42
2

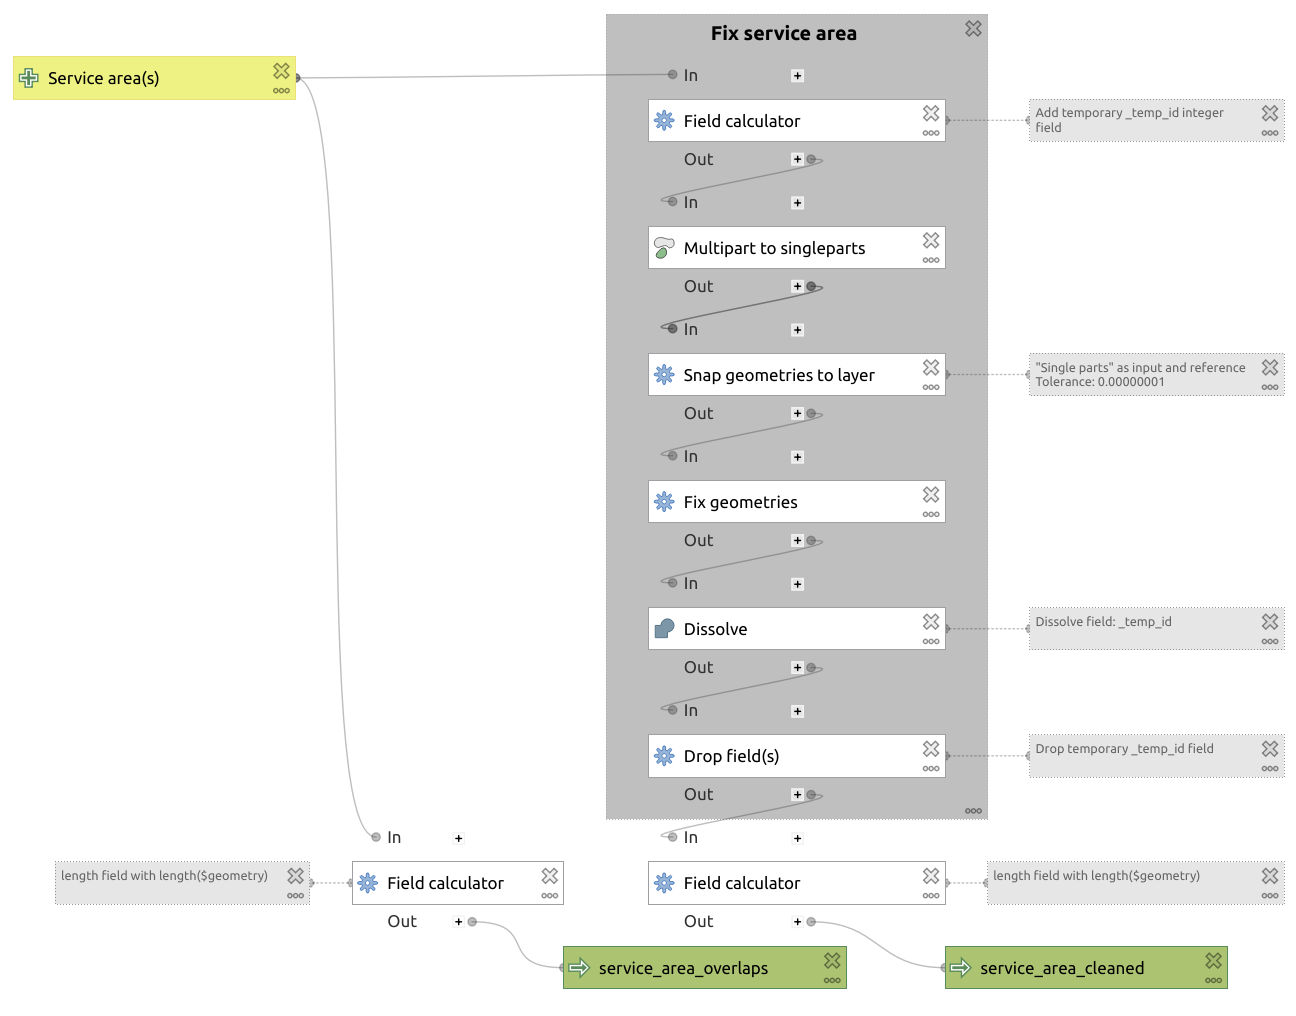
This is the solution that seems most performant and useful for me:

Model for correct service area length

It contains the basic steps to clean the service area based on this answer to "Remove partly overlapping geometries from service area in QGIS" (see explanations there). As outputs there are the service area(s) with overlaps and the cleaned service area(s), each with a length field added.

EDIT:

After a few more tests I can confirm that this works principally if the number of vertices is not too large. However, I had to "unaccept" my (so far preferred) answer because there is a serious performance issue when running this over a large number of complex service areas, which is necessary in my case. "Snap geometries to layer" on a very large number of points takes much (!) longer than the solution presented in the OP, where the intersection part is the most time-consuming step, but still a lot faster than this solution (4 minutes vs. 32 minutes for over 90 complex 750 meter service areas on my machine).

Your Answer

By clicking “Post Your Answer”, you agree to our terms of service and acknowledge you have read our privacy policy.

Not the answer you're looking for? Browse other questions tagged or ask your own question.