9

I am wondering if there is a way to find the minimum bounding extent for a raster with a particular value. I clipped a raster from a global image and the extent is set as the global extent with a lot of NoData area. I would like to remove the NoData area from this raster and retain only the area containing the pixels of the particular value. How can I do this?

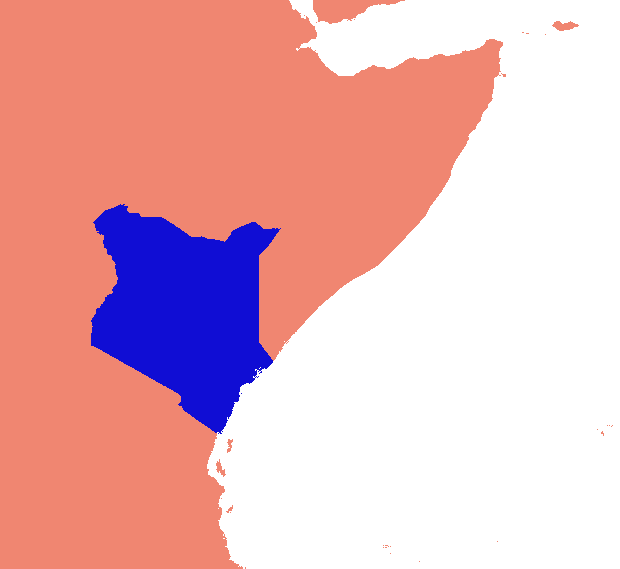
Here is my example: I would like to extract value = 1 (Blue area) and use the blue area's extent rather than the whole world for further processing.

Sample Image

7
  • Could you post a sample?
    – Aaron
    Commented Jan 4, 2013 at 0:36
  • "I would like to delete the null rows and columns for this raster." What exactly does this mean? I don't understand what the desired end result is.
    – blah238
    Commented Jan 4, 2013 at 0:54
  • By "minimum bounding extent" are you looking for a rectangular extent or a polygonal footprint representing the area of the image with data?
    – blah238
    Commented Jan 4, 2013 at 0:55
  • 1
    @Tomek, the OP is looking to find the extent, not have to create it manually.
    – blah238
    Commented Jan 4, 2013 at 9:40
  • 1
    If literally anything is fair game, then some software has built-in commands to do this; see reference.wolfram.com/mathematica/ref/ImageCrop.html for instance.
    – whuber
    Commented Mar 21, 2013 at 21:00

6 Answers 6

9

The trick is to compute the limits of the data that have values. Perhaps the fastest, most natural, and most general way to obtain these is with zonal summaries: by using all non-NoData cells for the zone, the zonal min and max of grids containing the X and Y coordinates will provide the full extent.

ESRI keeps changing the ways in which these calculations can be done; for instance, built-in expressions for the coordinate grids were dropped with ArcGIS 8 and appear not to have returned. Just for fun, here's a set of fast, simple calculations that will do the job no matter what.

  1. Convert the grid into a single zone by equating it with itself, as in

    "My grid" == "My grid"

  2. Create a column index grid by flow-accumulating a constant grid with value 1. (The indexes will start with 0.) If desired, multiply this by the cellsize and add the x-coordinate of the origin to obtain an x-coordinate grid "X" (shown below).

  3. Similarly, create a row index grid (and then a y-coordinate grid "Y") by flow-accumulating a constant grid with value 64.

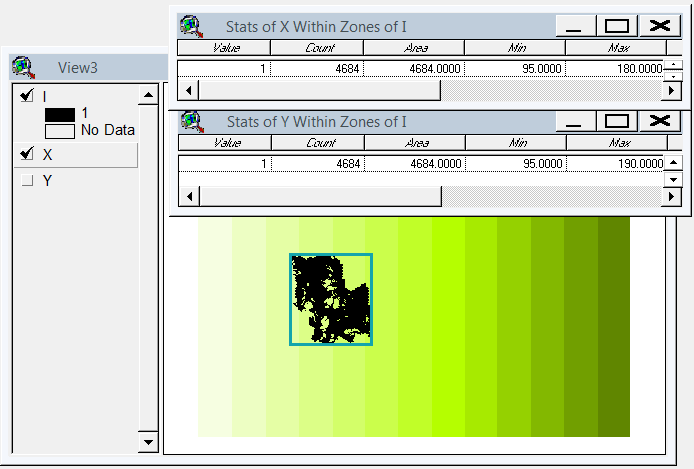
  4. Use the zone grid from step (1) to compute the zonal min and max of "X" and "Y": you now have the desired extent.

Final image

(The extent, as shown in the two tables of zonal statistics, is depicted by a rectangular outline in this figure. Grid "I" is the zone grid obtained in step (1).)

To go further, you will need to extract these four numbers from their output tables and use them to limit the analysis extent. Copying the original grid, with the restricted analysis extent in place, completes the task.

8

Here's a version of @whubers method for ArcGIS 10.1+ as a python toolbox (.pyt).

import arcpy

class Toolbox(object):
    def __init__(self):
        """Define the toolbox (the name of the toolbox is the name of the
        .pyt file)."""
        self.label = "Raster Toolbox"
        self.alias = ""

        # List of tool classes associated with this toolbox
        self.tools = [ClipNoData]


class ClipNoData(object):
    def __init__(self):
        """Clip raster extent to the data that have values"""
        self.label = "Clip NoData"
        self.description = "Clip raster extent to the data that have values. "
        self.description += "Method by Bill Huber - https://gis.stackexchange.com/a/55150/2856"

        self.canRunInBackground = False

    def getParameterInfo(self):
        """Define parameter definitions"""
        params = []

        # First parameter
        params+=[arcpy.Parameter(
            displayName="Input Raster",
            name="in_raster",
            datatype='GPRasterLayer',
            parameterType="Required",
            direction="Input")
        ]

        # Second parameter
        params+=[arcpy.Parameter(
            displayName="Output Raster",
            name="out_raster",
            datatype="DERasterDataset",
            parameterType="Required",
            direction="Output")
        ]

        return params

    def isLicensed(self):
        """Set whether tool is licensed to execute."""
        return arcpy.CheckExtension('spatial')==u'Available'

    def execute(self, parameters, messages):
        """See https://gis.stackexchange.com/a/55150/2856
           ##Code comments paraphrased from @whubers GIS StackExchange answer
        """
        try:
            #Setup
            arcpy.CheckOutExtension('spatial')
            from arcpy.sa import *
            in_raster = parameters[0].valueAsText
            out_raster = parameters[1].valueAsText

            dsc=arcpy.Describe(in_raster)
            xmin=dsc.extent.XMin
            ymin=dsc.extent.YMin
            mx=dsc.meanCellWidth
            my=dsc.meanCellHeight
            arcpy.env.extent=in_raster
            arcpy.env.cellSize=in_raster
            arcpy.AddMessage(out_raster)

            ## 1. Convert the grid into a single zone by equating it with itself
            arcpy.AddMessage(r'1. Convert the grid into a single zone by equating it with itself...')
            zones = Raster(in_raster) == Raster(in_raster)

            ## 2. Create a column index grid by flow-accumulating a constant grid
            ##    with value 1. (The indexes will start with 0.) Multiply this by
            ##    the cellsize and add the x-coordinate of the origin to obtain
            ##    an x-coordinate grid.
            arcpy.AddMessage(r'Create a constant grid...')
            const = CreateConstantRaster(1)

            arcpy.AddMessage(r'2. Create an x-coordinate grid...')
            xmap = (FlowAccumulation(const)) * mx + xmin

            ## 3. Similarly, create a y-coordinate grid by flow-accumulating a
            ##    constant grid with value 64.
            arcpy.AddMessage(r'3. Create a y-coordinate grid...')
            ymap = (FlowAccumulation(const * 64)) * my + ymin

            ## 4. Use the zone grid from step (1) to compute the zonal min and
            ##    max of "X" and "Y"
            arcpy.AddMessage(r'4. Use the zone grid from step (1) to compute the zonal min and max of "X" and "Y"...')

            xminmax=ZonalStatisticsAsTable(zones, "value", xmap,r"IN_MEMORY\xrange", "NODATA", "MIN_MAX")
            xmin,xmax=arcpy.da.SearchCursor(r"IN_MEMORY\xrange", ["MIN","MAX"]).next()

            yminmax=ZonalStatisticsAsTable(zones, "value", ymap,r"IN_MEMORY\yrange", "NODATA", "MIN_MAX")
            ymin,ymax=arcpy.da.SearchCursor(r"IN_MEMORY\yrange", ["MIN","MAX"]).next()

            arcpy.Delete_management(r"IN_MEMORY\xrange")
            arcpy.Delete_management(r"IN_MEMORY\yrange")

            # Write out the reduced raster
            arcpy.env.extent = arcpy.Extent(xmin,ymin,xmax+mx,ymax+my)
            output = Raster(in_raster) * 1
            output.save(out_raster)

        except:raise
        finally:arcpy.CheckInExtension('spatial')
4
  • Very nice Luke. Self contained, runnable, uses in_memory, and well commented to boot. I had to turn off background processing (Geoprocessing > options >...) to get it working. Commented Mar 22, 2013 at 15:52
  • 1
    I've updated the script and set canRunInBackground=False. I will note that it's worth changing the workspace/scratchworkspace environments to a local folder (not FGDB) as I found when I left them as default (i.e <network user profile>\Default.gdb) the script took 9min!!! to run on a 250x250 cell grid. Changing to a local FGDB it took 9sec and to a local folder 1-2sec...
    – user2856
    Commented Mar 22, 2013 at 20:31
  • good point about local folders, and thanks for the quick background fix (much better than writing instructions for everyone I pass it to). Might be worth throwing this up on bitbucket/github/gcode/etc. Commented Mar 22, 2013 at 20:42
  • +1 Thanks for this contribution, Luke! I appreciate you filling in the (rather large) gap left in my answer.
    – whuber
    Commented Mar 23, 2013 at 3:34
6

IF I have understood the question correctly it sounds like you want know the minimum bounding box of the values that are not null.Maybe you could convert the raster to polygons, select the polygons you are interested in and then convert them back to a raster. You can then look at the properties values which should give you the minium bounding box.

3
  • 1
    All told this is probably the best approach given the confines of the ArcGIS raster processing workflow.
    – blah238
    Commented Jan 4, 2013 at 9:35
  • I did this exactly. Is there any automatic way? I think the raster to polygon algorithm has a step to extract the minimum bounding box of the raster.
    – Seen
    Commented Jan 4, 2013 at 15:25
  • are you after a python solution?
    – dango
    Commented Jan 7, 2013 at 11:52
4

I've devised a gdal and numpy based solution. It breaks the raster matrix into rows and columns and drop any empty row/column. In this implementation "empty" is anything less than 1, and only single band rasters accounted for.

(I realise as I write that this scanline approach is only suitable for images with nodata "collars". If your data are islands in seas of nulls, the space between islands will get dropped as well, squishing everything together and totally messing up the georeferencing.)

The business parts (needs fleshing out, won't work as is):

    #read raster into a numpy array
    data = np.array(gdal.Open(src_raster).ReadAsArray())
    #scan for data
    non_empty_columns = np.where(data.max(axis=0)>0)[0]
    non_empty_rows = np.where(data.max(axis=1)>0)[0]
        # assumes data is any value greater than zero
    crop_box = (min(non_empty_rows), max(non_empty_rows),
        min(non_empty_columns), max(non_empty_columns))

    # retrieve source geo reference info
    georef = raster.GetGeoTransform()
    xmin, ymax = georef[0], georef[3]
    xcell, ycell = georef[1], georef[5]

    # Calculate cropped geo referencing
    new_xmin = xmin + (xcell * crop_box[0]) + xcell
    new_ymax = ymax + (ycell * crop_box[2]) - ycell
    cropped_transform = new_xmin, xcell, 0.0, new_ymax, 0.0, ycell

    # crop
    new_data = data[crop_box[0]:crop_box[1]+1, crop_box[2]:crop_box[3]+1]

    # write to disk
    band = out_raster.GetRasterBand(1)
    band.WriteArray(new_data)
    band.FlushCache()
    out_raster = None

In a full script:

import os
import sys
import numpy as np
from osgeo import gdal

if len(sys.argv) < 2:
    print '\n{} [infile] [outfile]'.format(os.path.basename(sys.argv[0]))
    sys.exit(1)

src_raster = sys.argv[1]
out_raster = sys.argv[2]

def main(src_raster):
    raster = gdal.Open(src_raster)

    # Read georeferencing, oriented from top-left
    # ref:GDAL Tutorial, Getting Dataset Information
    georef = raster.GetGeoTransform()
    print '\nSource raster (geo units):'
    xmin, ymax = georef[0], georef[3]
    xcell, ycell = georef[1], georef[5]
    cols, rows = raster.RasterYSize, raster.RasterXSize
    print '  Origin (top left): {:10}, {:10}'.format(xmin, ymax)
    print '  Pixel size (x,-y): {:10}, {:10}'.format(xcell, ycell)
    print '  Columns, rows    : {:10}, {:10}'.format(cols, rows)

    # Transfer to numpy and scan for data
    # oriented from bottom-left
    data = np.array(raster.ReadAsArray())
    non_empty_columns = np.where(data.max(axis=0)>0)[0]
    non_empty_rows = np.where(data.max(axis=1)>0)[0]
    crop_box = (min(non_empty_rows), max(non_empty_rows),
        min(non_empty_columns), max(non_empty_columns))

    # Calculate cropped geo referencing
    new_xmin = xmin + (xcell * crop_box[0]) + xcell
    new_ymax = ymax + (ycell * crop_box[2]) - ycell
    cropped_transform = new_xmin, xcell, 0.0, new_ymax, 0.0, ycell

    # crop
    new_data = data[crop_box[0]:crop_box[1]+1, crop_box[2]:crop_box[3]+1]

    new_rows, new_cols = new_data.shape # note: inverted relative to geo units
    #print cropped_transform

    print '\nCrop box (pixel units):', crop_box
    print '  Stripped columns : {:10}'.format(cols - new_cols)
    print '  Stripped rows    : {:10}'.format(rows - new_rows)

    print '\nCropped raster (geo units):'
    print '  Origin (top left): {:10}, {:10}'.format(new_xmin, new_ymax)
    print '  Columns, rows    : {:10}, {:10}'.format(new_cols, new_rows)

    raster = None
    return new_data, cropped_transform


def write_raster(template, array, transform, filename):
    '''Create a new raster from an array.

        template = raster dataset to copy projection info from
        array = numpy array of a raster
        transform = geo referencing (x,y origin and pixel dimensions)
        filename = path to output image (will be overwritten)
    '''
    template = gdal.Open(template)
    driver = template.GetDriver()
    rows,cols = array.shape
    out_raster = driver.Create(filename, cols, rows, gdal.GDT_Byte)
    out_raster.SetGeoTransform(transform)
    out_raster.SetProjection(template.GetProjection())
    band = out_raster.GetRasterBand(1)
    band.WriteArray(array)
    band.FlushCache()
    out_raster = None
    template = None

if __name__ == '__main__':
    cropped_raster, cropped_transform = main(src_raster)
    write_raster(src_raster, cropped_raster, cropped_transform, out_raster)

The script is in my code stash on Github, if the link goes 404 hunt around a bit; these folders are ripe for some reorganization.
1
  • 1
    This won'y work for really large datasets. I get a MemoryError Source raster (geo units): Origin (top left): 2519950.0001220703, 5520150.00012207 Pixel size (x,-y): 100.0, -100.0 Columns, rows : 42000, 43200 Traceback (most recent call last): File "D:/11202067_COACCH/local_checkout/crop_raster.py", line 72, in <module> cropped_raster, cropped_transform = main(src_raster) File "D:/11202067_COACCH/local_checkout/crop_raster.py", line 22, in main data = np.array(raster.ReadAsArray()) MemoryError
    – user32882
    Commented Oct 24, 2018 at 13:05
2

For all its analytical power, ArcGIS lacks basic raster manipulations that you can find with traditional desktop image editors like GIMP. It expects that you want to use the same analysis extent for your output raster as your input raster, unless you manually override the Output Extent environment setting. Since this is exactly what you are looking to find, not set, the ArcGIS way of doing things is getting in the way.

Despite my best efforts, and without resorting to programming, I could find no way to get the extent of your desired subset of the image (without raster-to-vector conversion which is computationally wasteful).

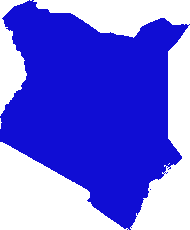
Instead, I used GIMP to select the blue area using the select by color tool and then inverted the selection, hit Delete to remove the rest of the pixels, inverted the selection again, cropped the image to selection, and finally exported it back out to PNG. GIMP saved it as a 1-bit depth image. The result is below:

Output

Of course, because your sample image lacked a spatial reference component, and GIMP is not spatially aware, the output image is about as useful as your sample input. You will need to georeference it for it to be of use in a spatial analysis.

3
  • Actually, this operation used to be easy in previous versions of Spatial Analyst: the zonal max and min of the two coordinate grids (X and Y), using the feature as the zone, give the extent exactly. (Well, you might want to expand it by half a cellsize in all four directions.) In ArcGIS 10, you need to be creative (or to use Python) to make a coordinate grid. Regardless, the whole thing can be done entirely within SA using only grid operations and no manual intervention.
    – whuber
    Commented Jan 4, 2013 at 14:45
  • @whuber I saw your solution somewhere else, but still not sure how I can implement your method. Could you show me some more detail of this?
    – Seen
    Commented Jan 4, 2013 at 15:24
  • @Seen A quick search of this site finds an account of the method at gis.stackexchange.com/a/13467.
    – whuber
    Commented Jan 4, 2013 at 16:00
1

Here is one possibility using SAGA GIS: http://permalink.gmane.org/gmane.comp.gis.gdal.devel/33021

In SAGA GIS there is a "Crop to Data" module (in Grid Tools module library), which performs the task.

But this would require you to import your Geotif with the GDAL import module, process it in SAGA, and finally export it as Geotif again with the GDAL export module.

Another possibility using only ArcGIS GP tools would be to build a TIN from your raster using Raster to TIN, compute its boundary using TIN Domain, and Clip your raster by the boundary (or its envelope using Feature Envelope to Polygon).

Your Answer

By clicking “Post Your Answer”, you agree to our terms of service and acknowledge you have read our privacy policy.

Not the answer you're looking for? Browse other questions tagged or ask your own question.