EDIT I have added question down
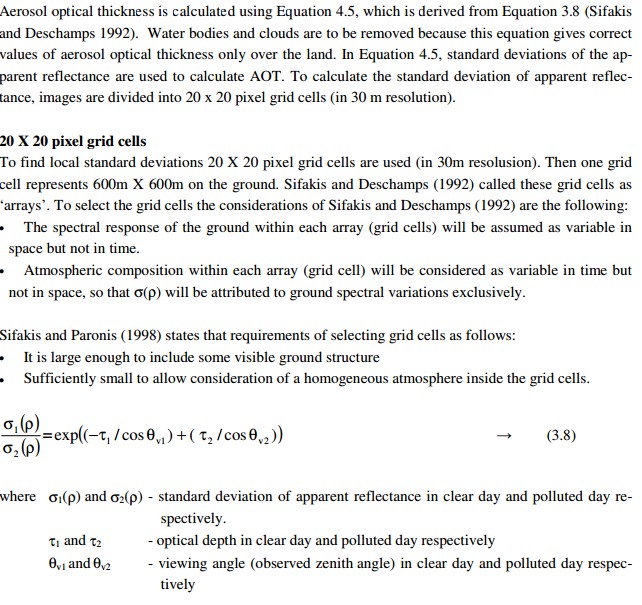
I am reading one paper and I found method to retrive AOT from landsat 7 image
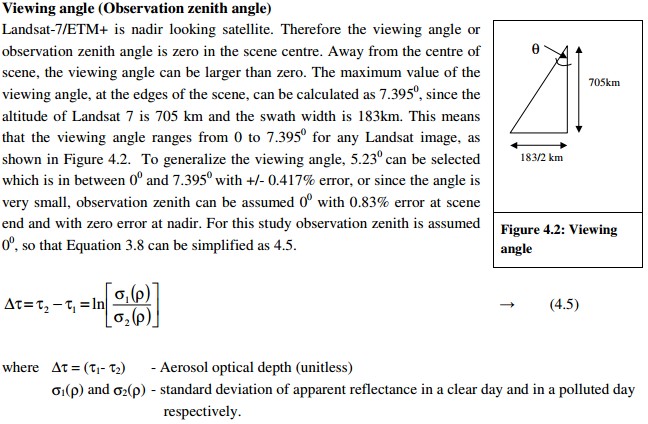
 This should be simplifield equation, because they assumed observation zenit as 0. Than they put on landsat image grid cell 20x20.
So have they calculated standard deviation for each cell and than with this equation they should get AOT also for each cell. Am I correct?
EDIT And at the end if I have AOT for first cell I just put in raster calc [raster1] * AOT1
-
Can you provide a link to the article? It'll help with the understanding and context of the equation.– Mikkel Lydholm RasmussenCommented Oct 19, 2015 at 19:34
-
@MikkelLydholmRasmussen I have added more. Cant find paper on internet. I have just saved it....– ABCDCommented Oct 20, 2015 at 8:23
-
3The equation is taken from the thesis Mapping of Dispersion of Urban Air Pollution Using Remote Sensing Techniques and Ground Truth Data by I.K. Wijeratne, submitted 2003 to ITC, Enschede.– KerstenCommented Oct 20, 2015 at 8:39
-
1Yes. Your understanding of the text appears to be correct. They split the land-pixels into 20x20 areas, calculate the standard deviations for both the "clear" day and the "polluted" day and use that to determine the AOT for the "polluted" day - under the assumption that the "clear" day has an AOT of 0.– Mikkel Lydholm RasmussenCommented Oct 20, 2015 at 10:25
-
1Mathematically, it doesn't have to be between 0 and 1. However, in most cases it likely will be. You should possibly implement a fix to remove potential negative values, which occurs if sigma-2 is bigger than sigma-1. And yes, each cell 20x20 cell has its own AOT, which is the whole point. Note that the approach assumes no changes in the surface between the two images, which is a risky assumption.– Mikkel Lydholm RasmussenCommented Oct 20, 2015 at 14:18
|
Show 11 more comments
