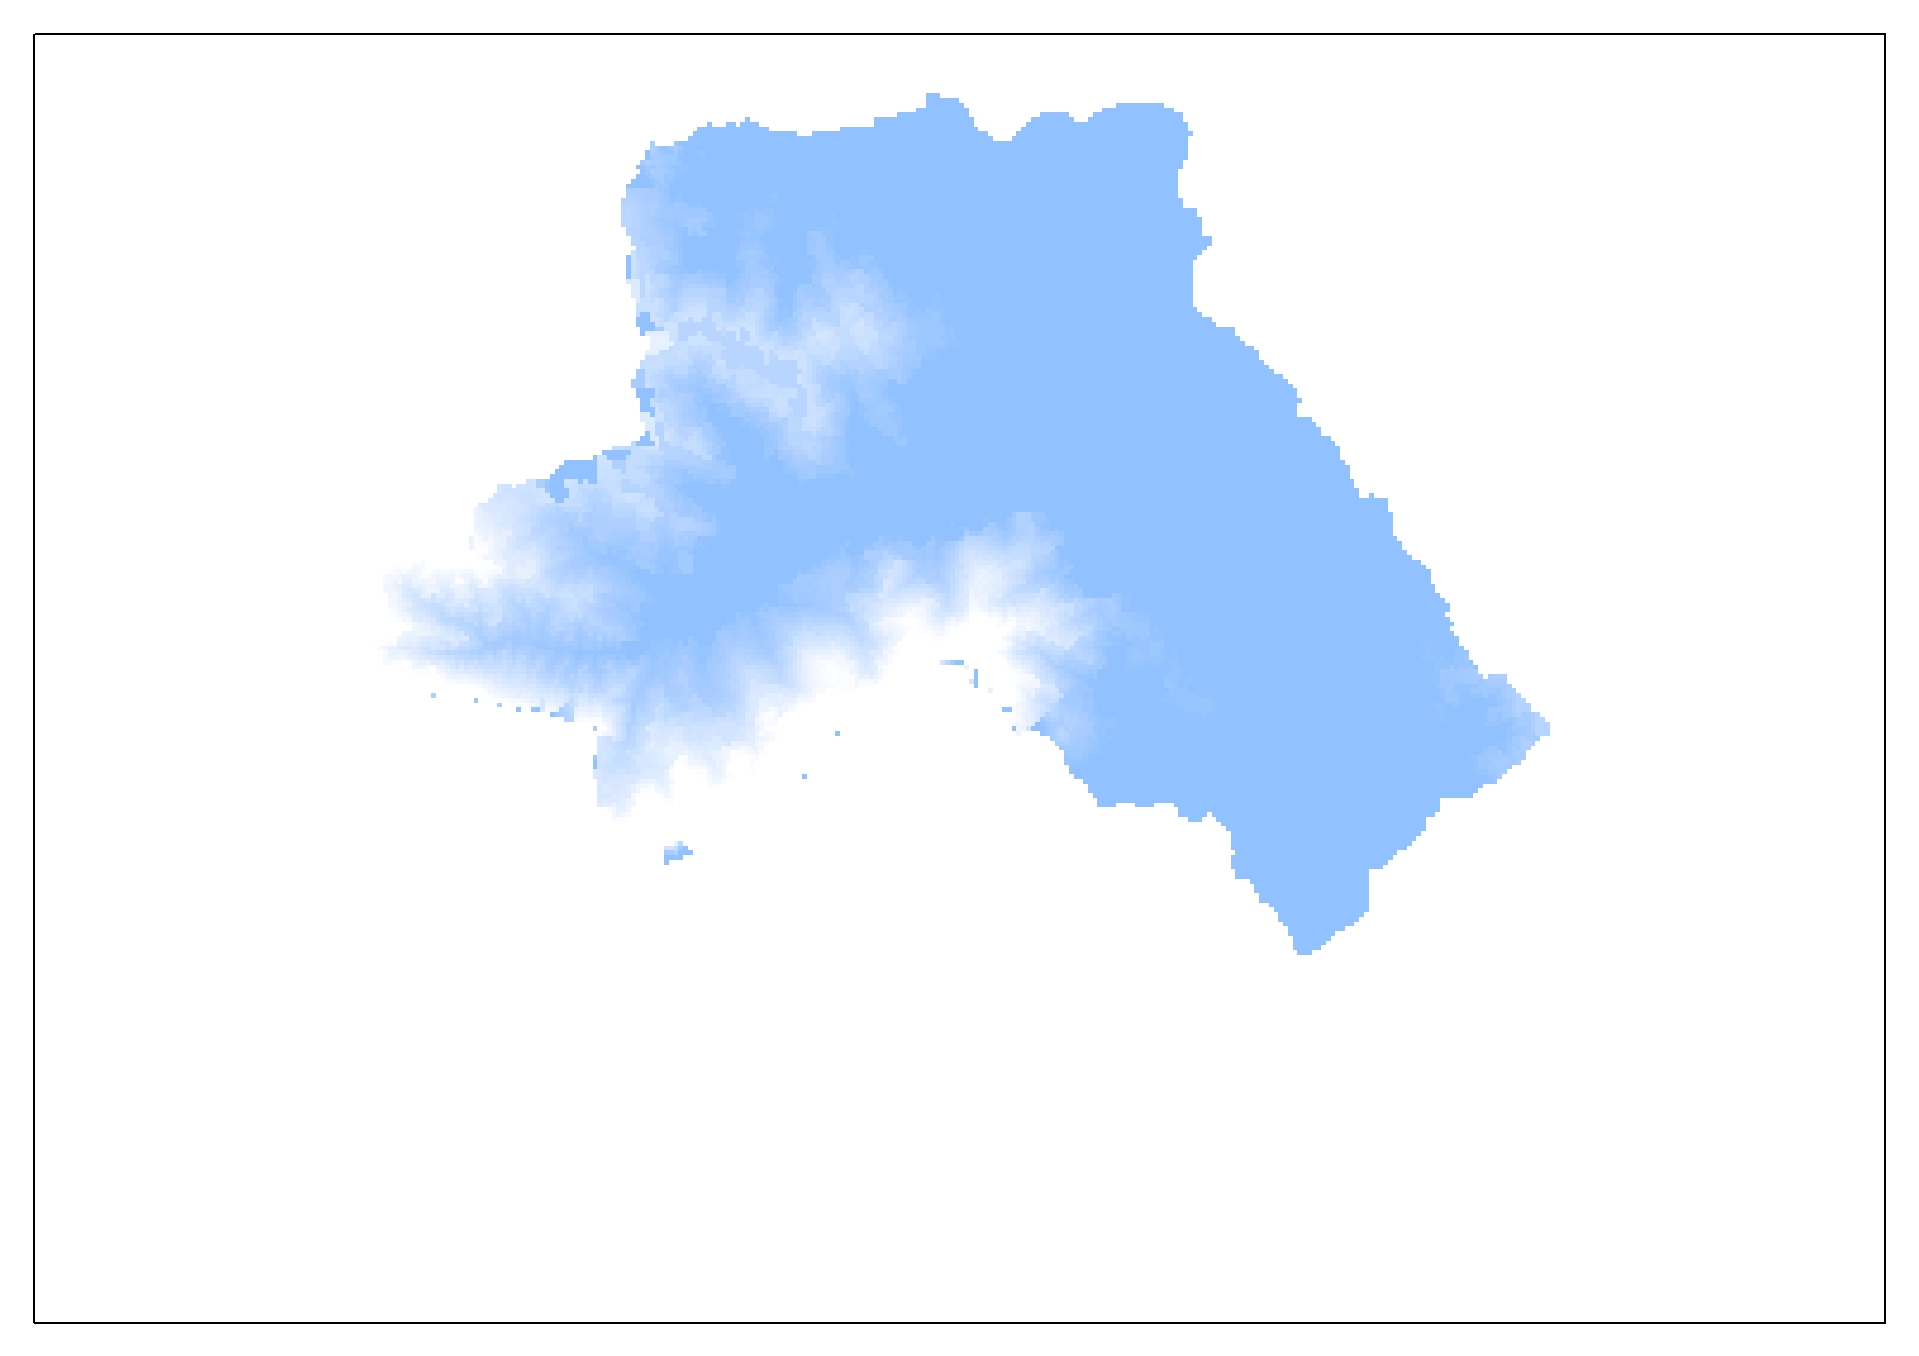
1

I am using ArcGIS Desktop 10.2.

I have the contours and the stream in AutoCAD Civil, after converting to a shapefile, I exported them in GIS, flowline+ contours in shapefile
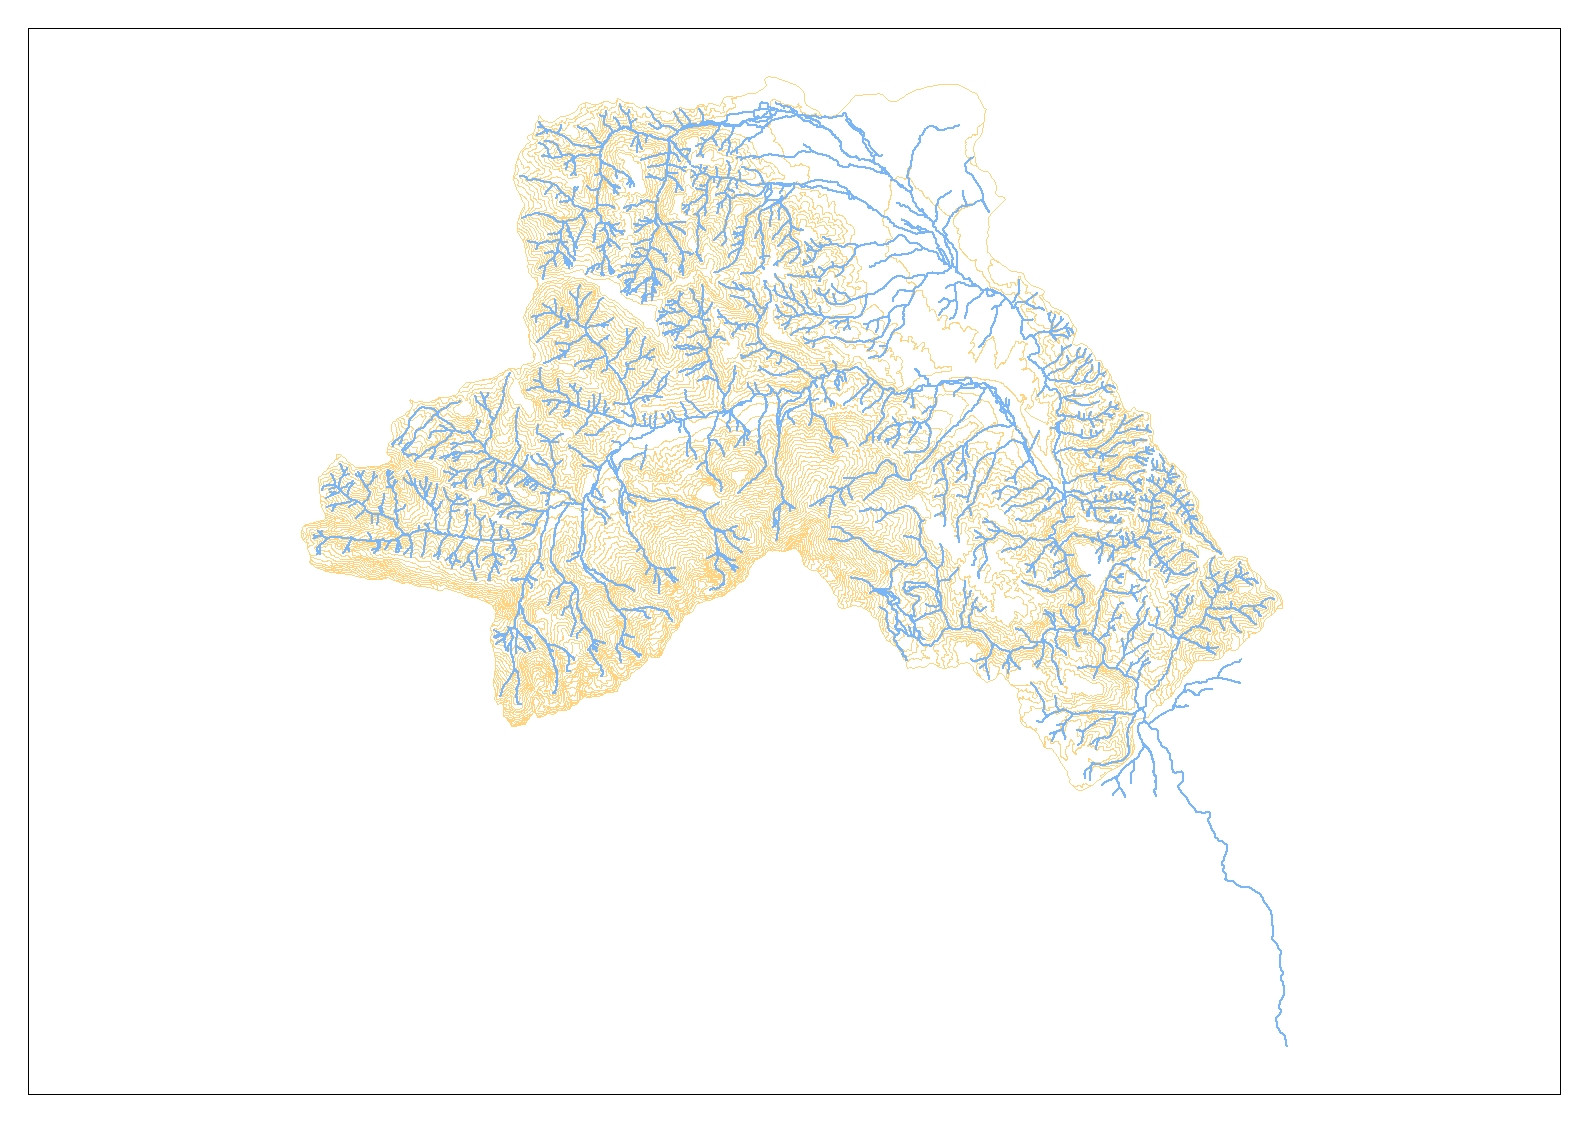
after I created the TIN from the contours below: tin created from contours
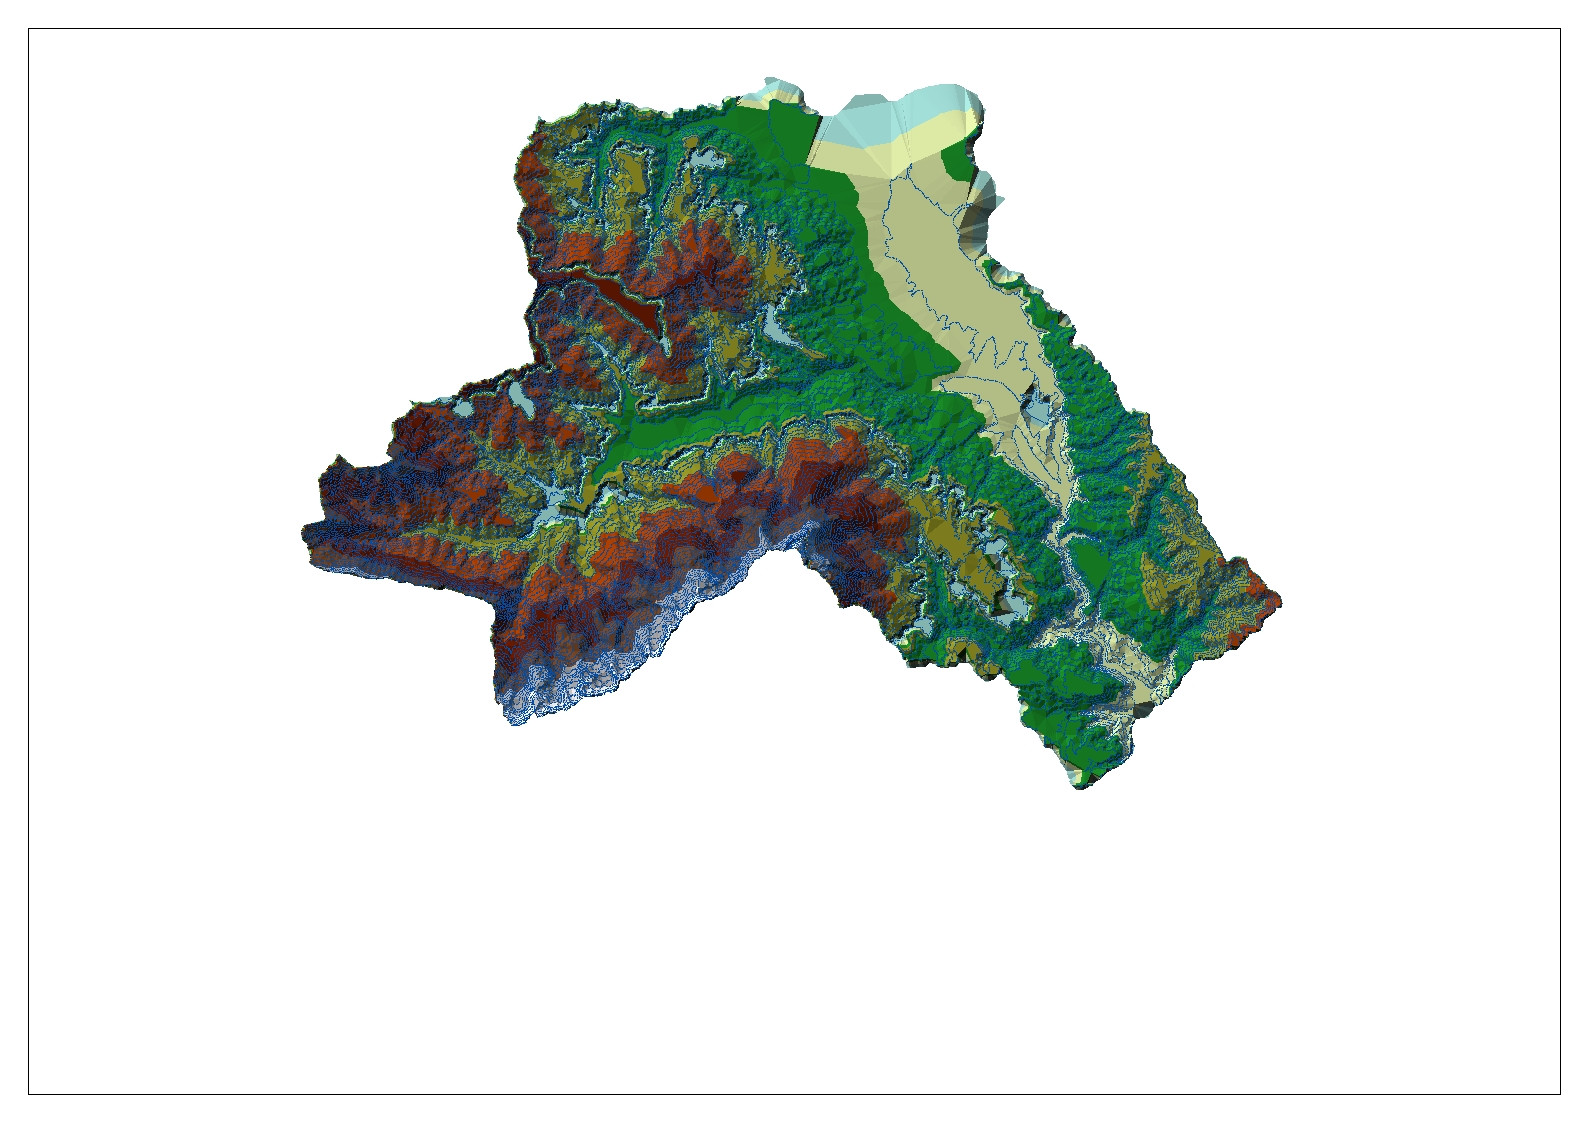
next I created the raster with the command TIN to raster : raster
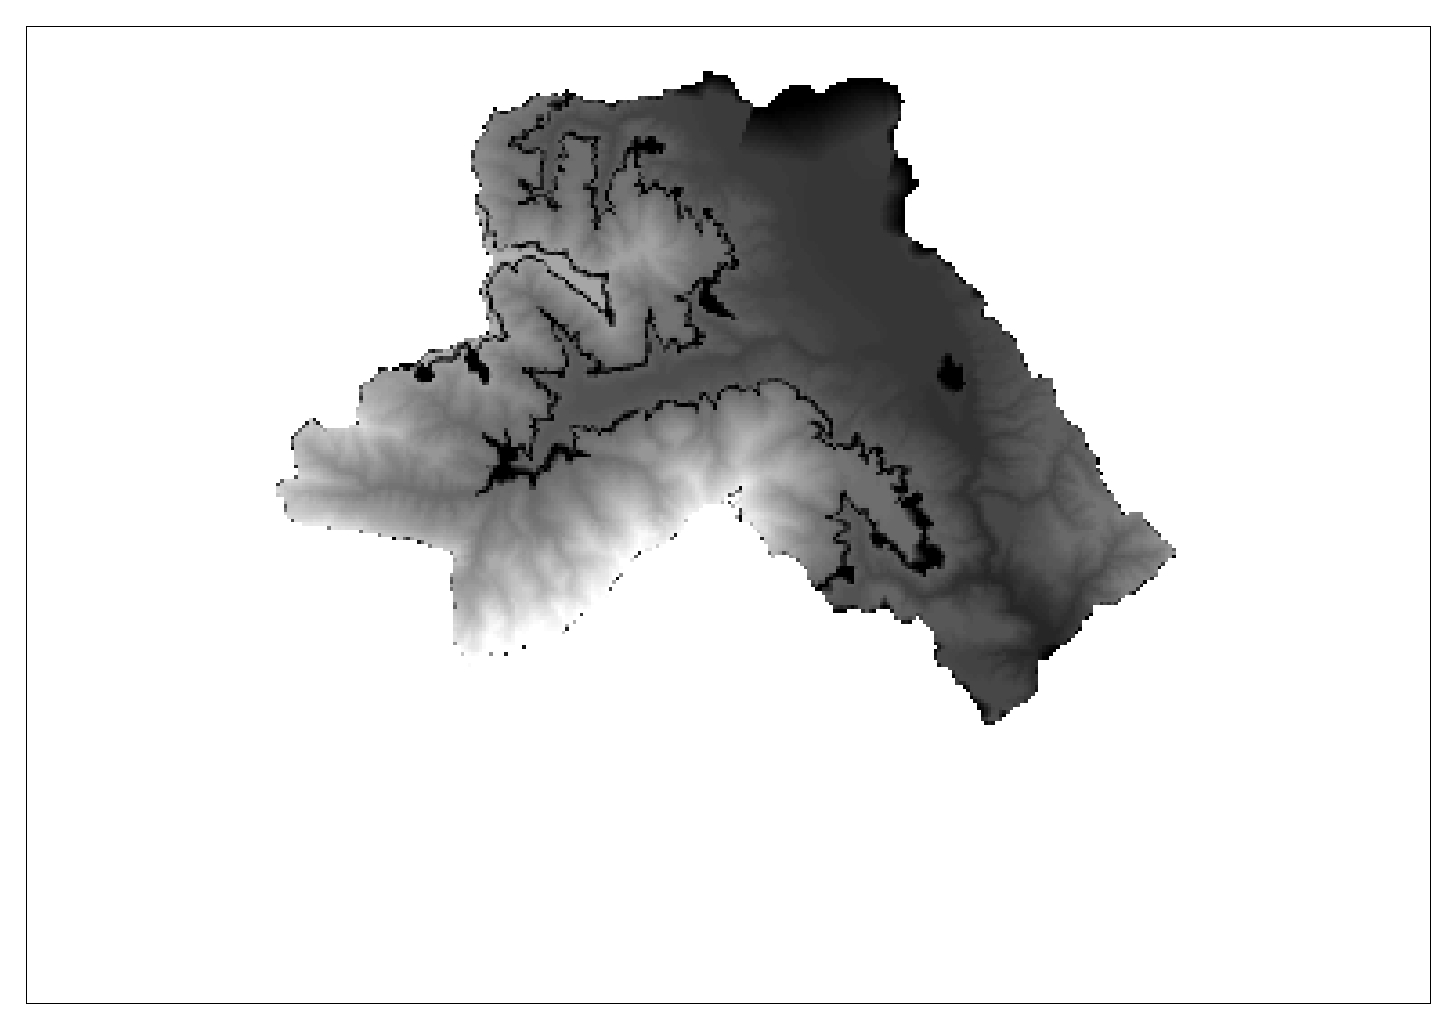
after creating the raster, I started using the arc-hydro tool, with DEM recognition, using the raster and the flowline, but I don't think the result of the AgreeDem is proper: AgreeDEM
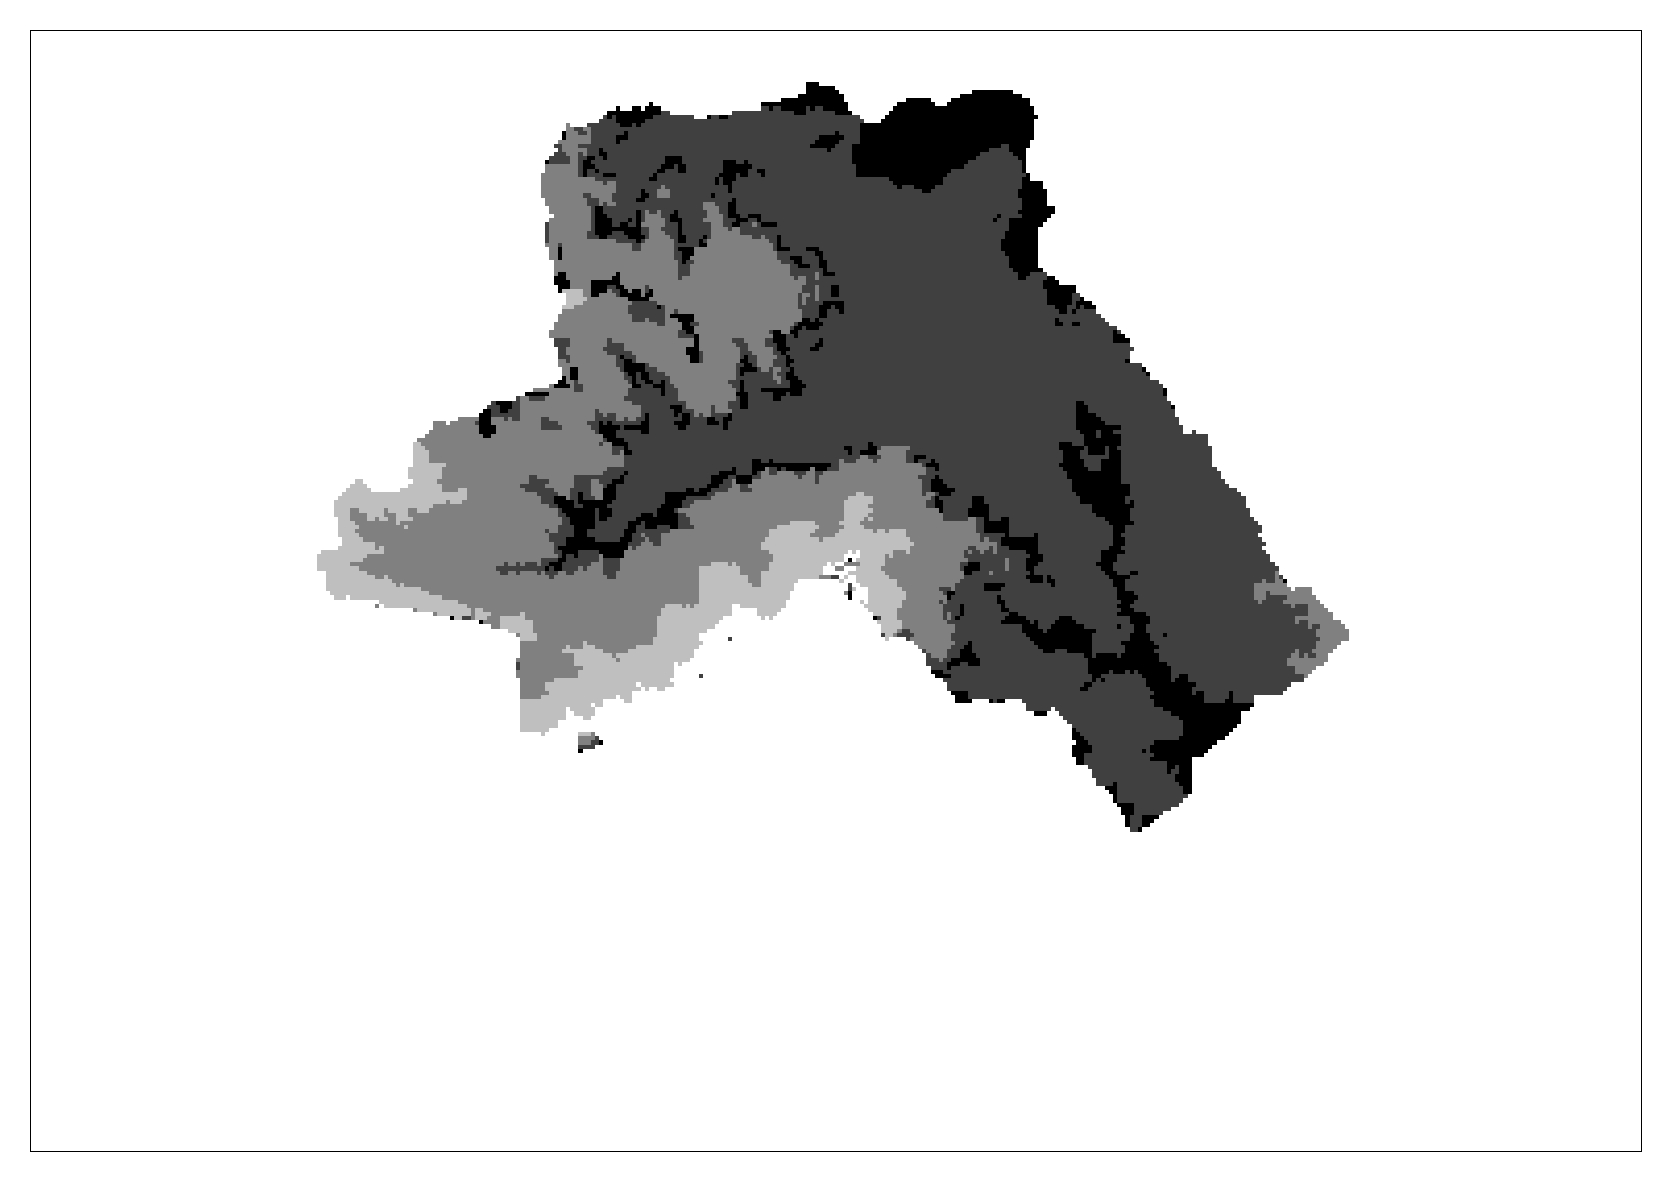
Continuing with the fill sinkfill sink option using the AgreeDem

after I did the flow direction part using the fill sink's results:

the next step is flow accumulation using the results from flow direction, but I don't think that the streams should be divided like I have in my results flow accumulation
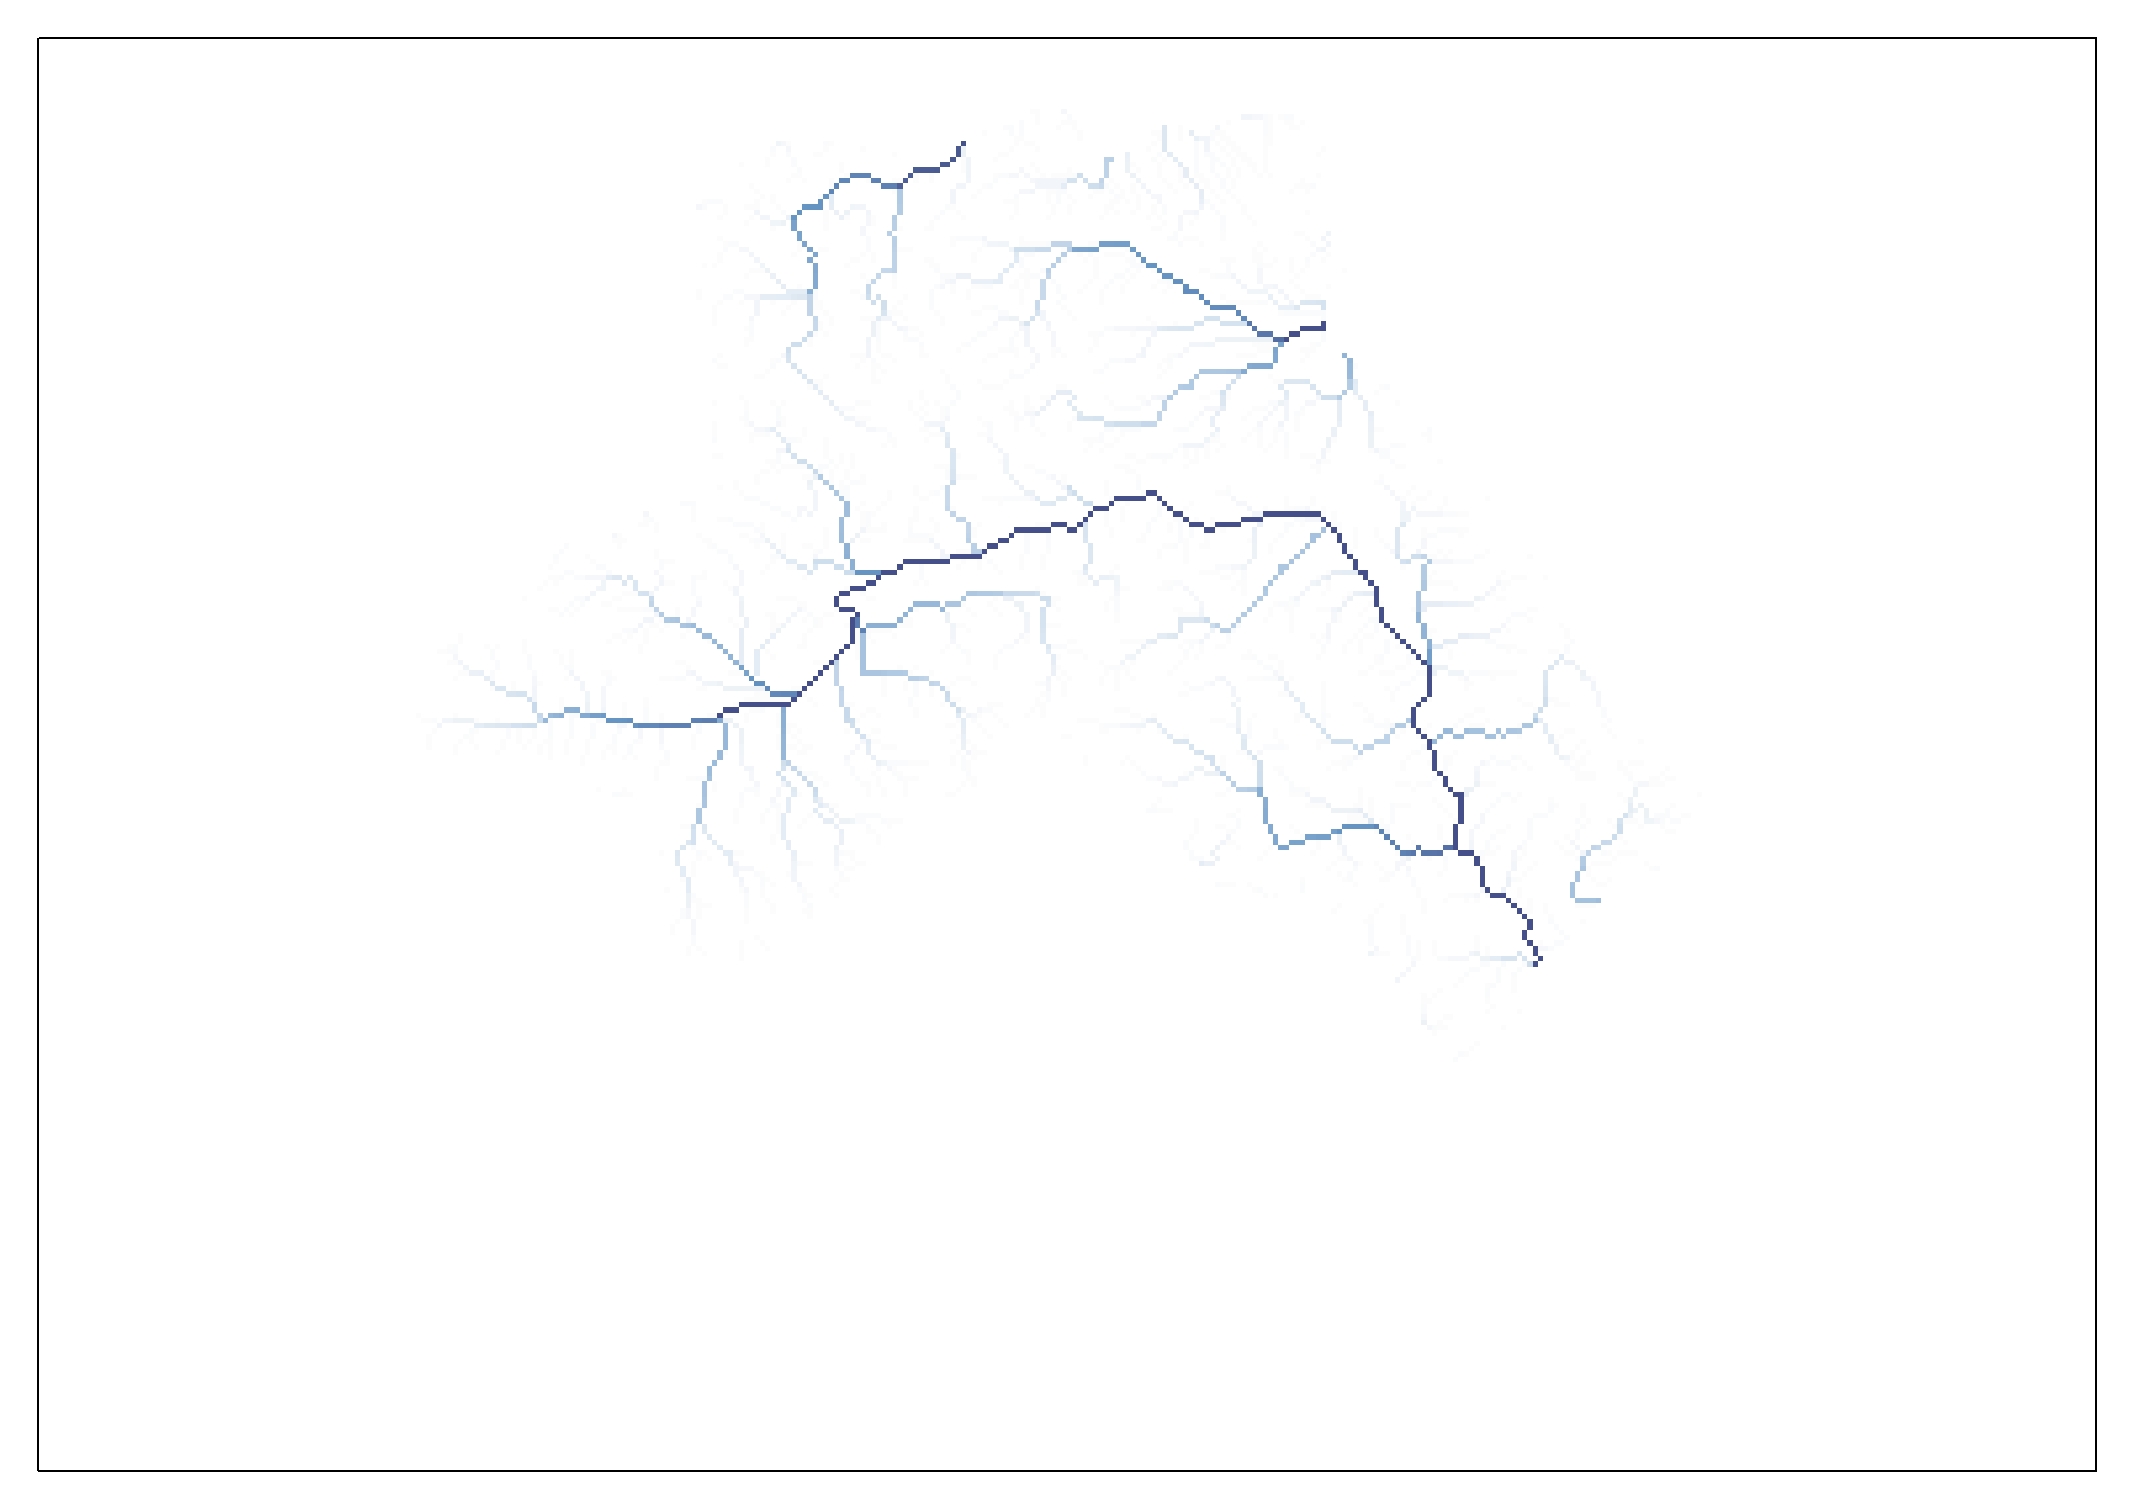
in stream definition I can obviously see that the results aren't as they should be, because there is no connection between the streams streamdefinition
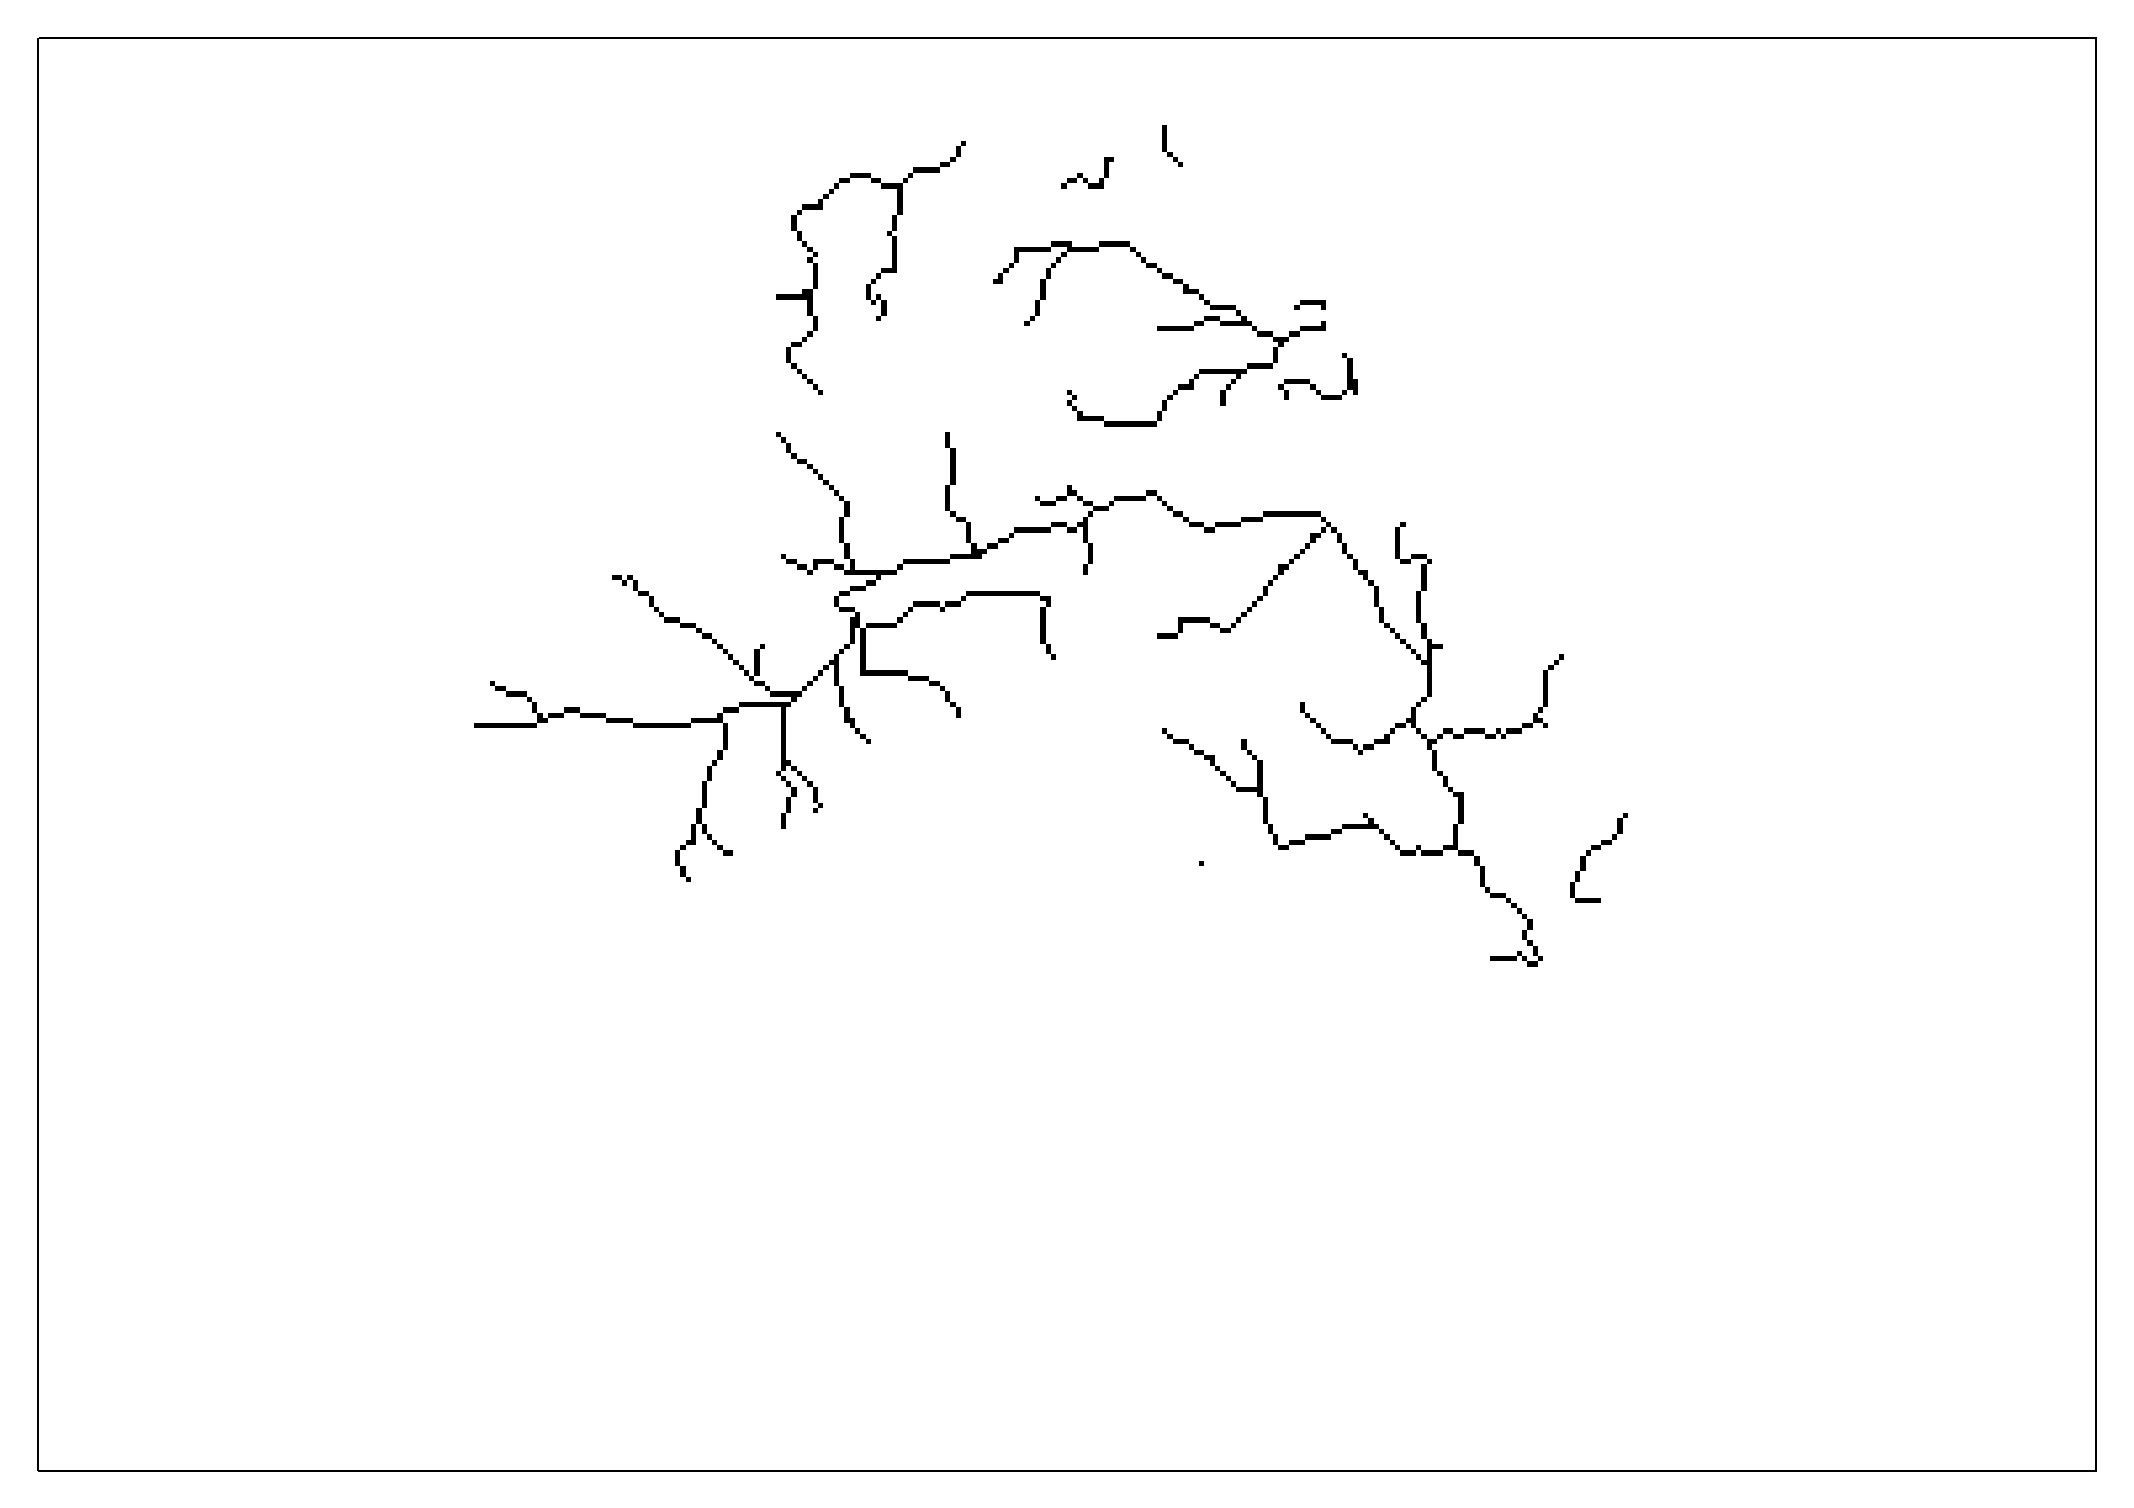
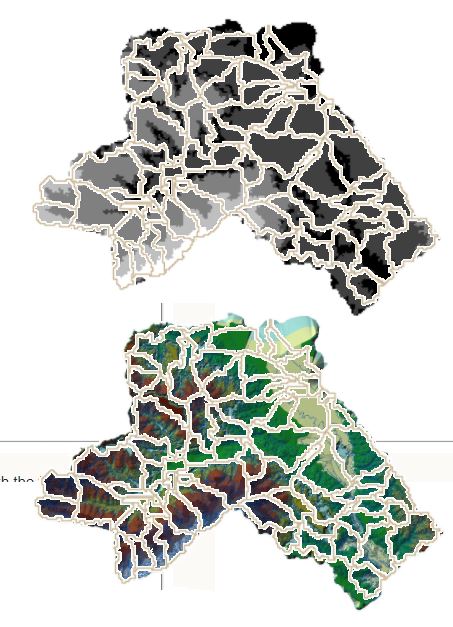
and if this part isn't proper neither the stream sedimentation nor catchment will be properly done or the catchment polygon which has same strange square shapes in some parts catchment polygon
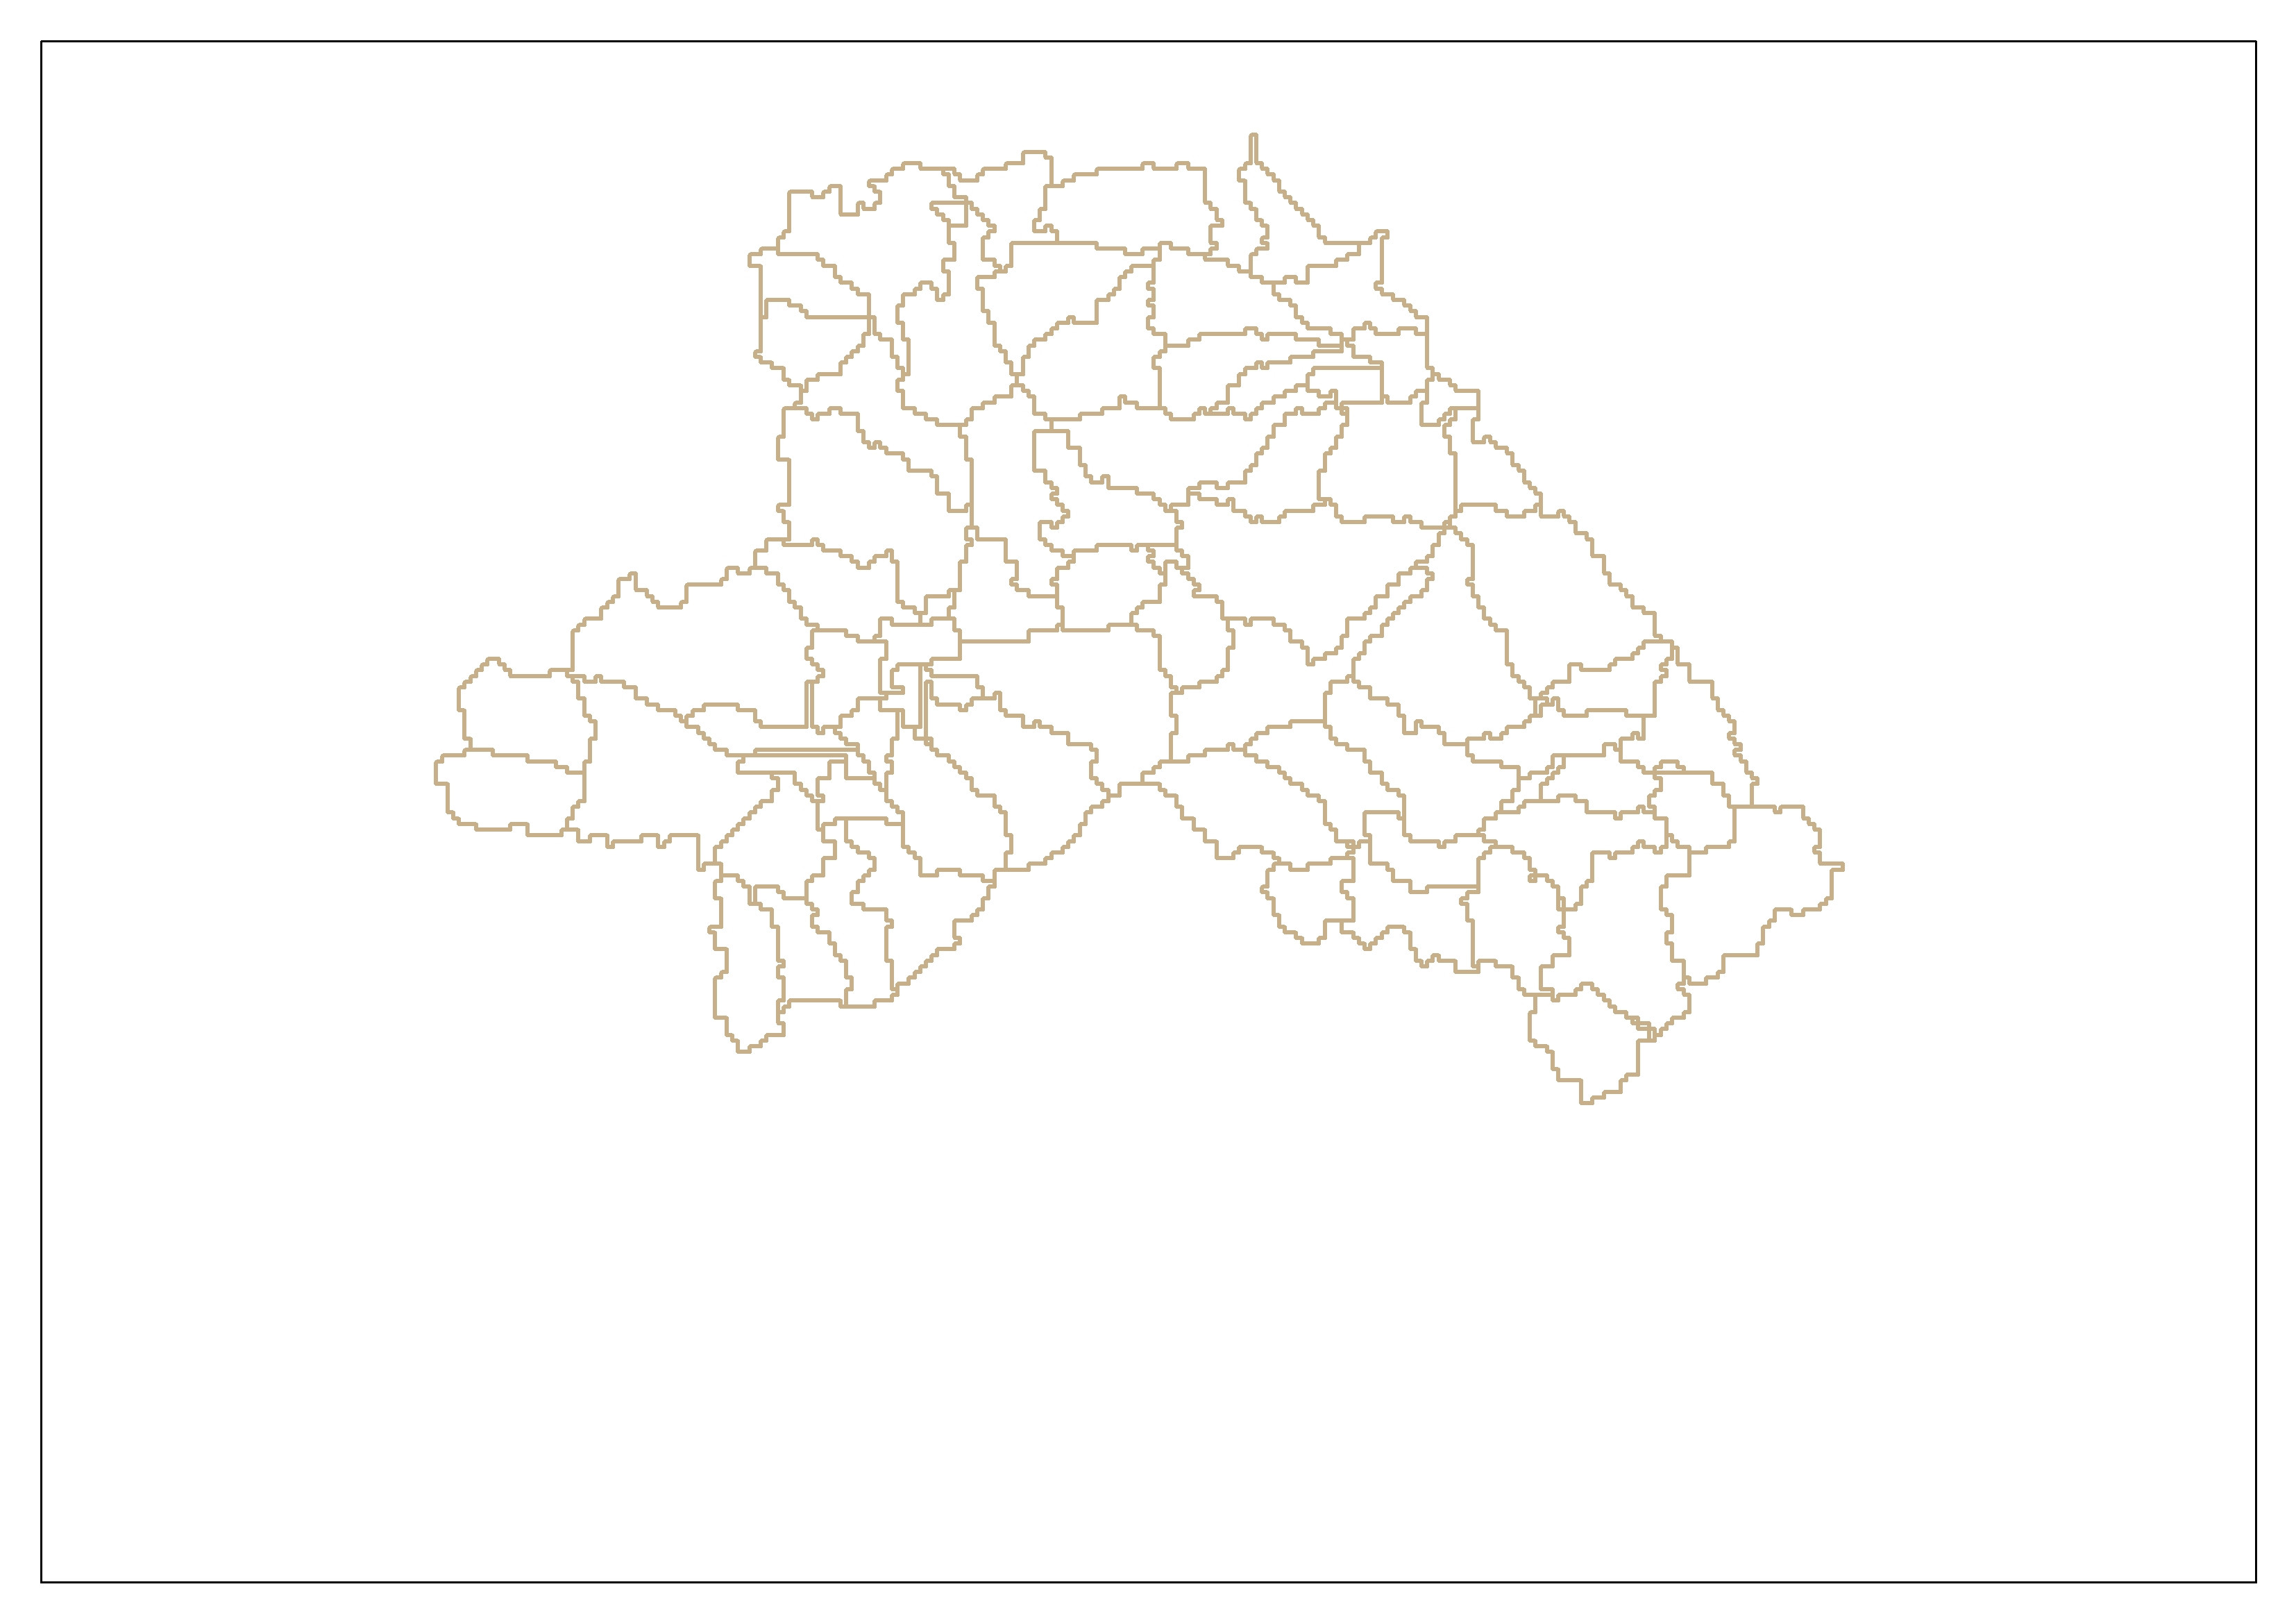
I have tried several times, but I don't know what to do in order to get the right results.

3
  • Thanks for posting a detailed explanation. From a visual point of view your TIN seems to have anomalies in the western most valley. It appears there is a low point which follows one or two contours. Maybe in reality this is correct, it just seems a little odd that there is such a defined low point at that location. You can see it prominently in image 3. Try checking the countour values for that location. Commented Feb 16, 2018 at 13:15
  • Forget about TIN, make sure your streams head down stream and use them with contours as input to topo to raster tool. Use arrow in the middle symbol for streams, to see which ones to flip.
    – FelixIP
    Commented Feb 17, 2018 at 19:00
  • And yes, your contours are wrong in multiple locations. It happens all the time with cad.
    – FelixIP
    Commented Feb 17, 2018 at 19:18

3 Answers 3

3

Watershed delineation is tricky, I usually include a larger area then my study area so I don't have anything weird at the edges. i.e. like the edges are cliffs or walls. With that being said, I also include a background stream layer to check that my calculated stream fits the background stream. This stream layer could be a topo map, just to confirm my data is following nature.

Your process looks good, however you need to overlay your streams over the basin layer. This may show your basin size is too small, you have a basin for every little stream segment. By increasing the basin size you will get a basin for each stream tributary.

Check your data by putting the basins layer over the tin, the polygon boundaries should follow the tin ridges. If it does your process is good. It's just not what you expected to see, which I guess was only a few basins.

It's like your trying to map forest cover but your data is showing every tree.

3

It looks like your issues may in large part be caused by the large flat in the NE portion of your basin. Different pit filling and flow direction algorithms will handle this area differently, and it looks like the one you are using is forcing the flow out of your basin instead of into your expected network.

First, Bill Chappell's answer provides some good advice about running these algorithms on a DEM that is larger than your basin. This reduces any confusion in ridge cells. If you have the option, buffer your expected watershed and use that mask for selecting your DEM.

To handle this large flat area, you may want to employ a Carving/Breaching algorithm rather than a filling one. ArcGIS does not includes one, but open source tools like Whitebox GIS include lots of good options. Alternatively, if you are confortable with your vector stream data, you could rasterize these lines and then burn them into your DEM by subtracting a nominal value from the DEM in all cells coincident with the stream. This will force flow into those pixels and connect the rest of your DEM to your network.

0

As noted by Bill Chappell you would likely benefit from getting more DEM coverage. Ideally, I would hope that my resulting watershed boundaries would not intersect the DEM limits. Your data is hitting the NO DATA in the DEM like a wall.

Watershed/DEM overlay

Your Answer

By clicking “Post Your Answer”, you agree to our terms of service and acknowledge you have read our privacy policy.

Not the answer you're looking for? Browse other questions tagged or ask your own question.