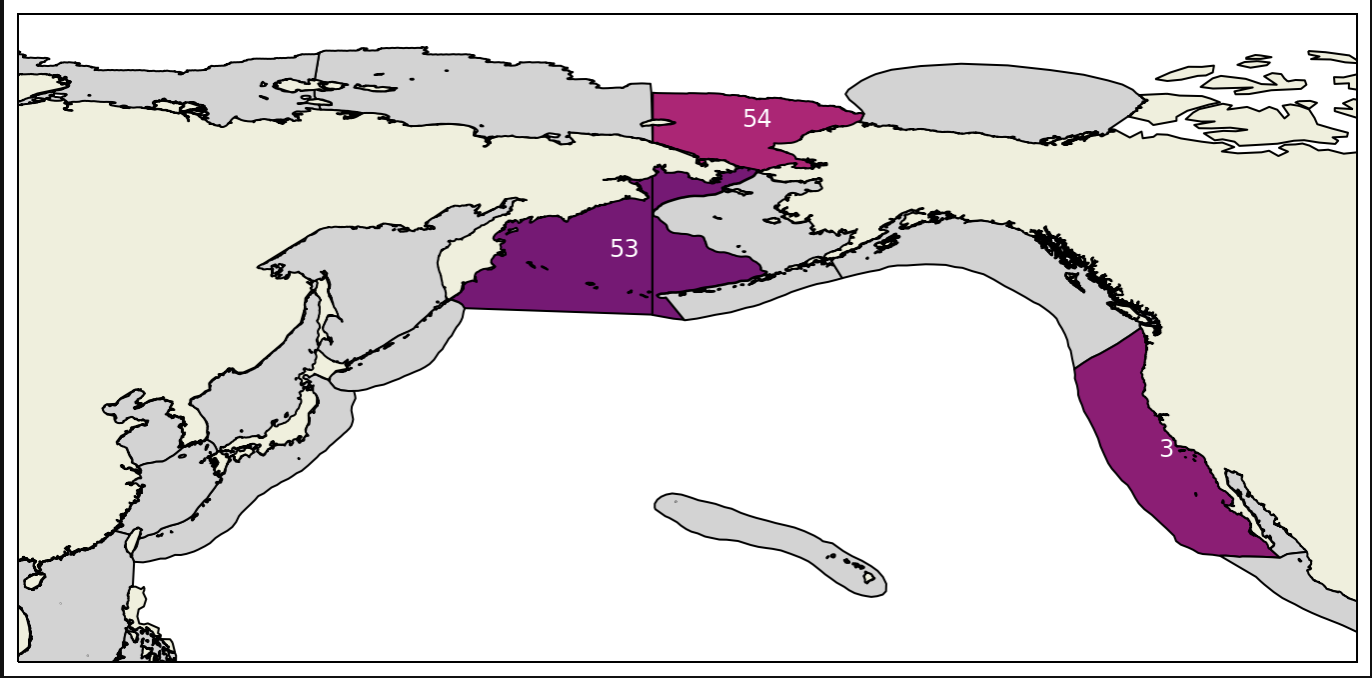
I want to extract CMIP6 climate data within polygons defined by a selection of the Large Marine Ecosystems of the world. The data(CMIP6) are found in ranges from 0 to 360 degrees longitude, while my Shapefile containing the polygons of the LMEs are -180 to 180 degrees longitude. I use Cartopy to do my plotting and I define the projection as ccrs.PlateCarree(central_longitude=-180). When I plot the polygons of interest the projection of my selected polygons are shown correctly (see image)
Next I read in my CMIP6 data (open archive on Google Cloud) and reassign their coordinates to be rolled 180 degrees longitude. I then try to extract data residing within the selected polygons. My extraction works but the data found are 180 degrees off (data for California are from the Mediterranean), suggesting the data are still not rolled correctly 180, or that I am doing something else wrong.
I wonder if anyone can shed some light on to what I am doing wrong here in terms of rolling the data 180. Is there some option I have to pass to rioarray? This should be trivial....
projection=ccrs.PlateCarree(central_longitude=-180)
ax = plt.subplot(1, 1, 1, projection=projection)
ax.coastlines()

extent = [-248, -100, 20, 85]
ax.set_extent(extent)
ax.add_feature(cfeature.LAND)
ax.add_feature(cfeature.COASTLINE)

records = pices.get_LME_records()

for key in config_pices_obj.dset_dict:
    ds=config_pices_obj.dset_dict[key]


    ds = ds.assign_coords(lon=(((ds.lon + 180) % 360) - 180)).sortby('lon')
    ds = pices.preprocessing_wrapper(ds)

    # Set the CRS of the CMIP6 data
    ds = ds.rio.write_crs(4326)
    print("Geometric projection of dataset : {}".format(ds.rio.crs))

    counter=0
    all_lmes=[]
    for LME_GEO, record in zip(records.geometries(), records.records()):
       LME_NAME = record.attributes['LME_NAME']
       LME_NUMBER = int(record.attributes['LME_NUMBER'])

       if (LME_NAME in config_pices_obj.LMES):
           print("=> LME_NAME {} ({})".format(LME_NAME,LME_NUMBER))
           ax.add_geometries([LME_GEO], projection,
               facecolor="None", edgecolor='k')

           geometries = [get_geometry_for_LME(LME_NAME)]

           # Clip the data inside the LME:
           clipped = ds.rio.clip(geometries=geometries, crs=ds.rio.crs)
           all_lmes.append(clipped)

      #  ds.tos.isel(time=0).plot(ax=ax, cmap='coolwarm',transform=ccrs.PlateCarree())

      #  plt.show()

   ds_lme=xr.merge(all_lmes)
   ds_lme.tos.isel(time=0).plot(ax=ax, transform=ccrs.PlateCarree(), cmap='coolwarm')

   plt.show()


ds=config_pices_obj.dset_dict[key]; ds.to_netcdf(...)?