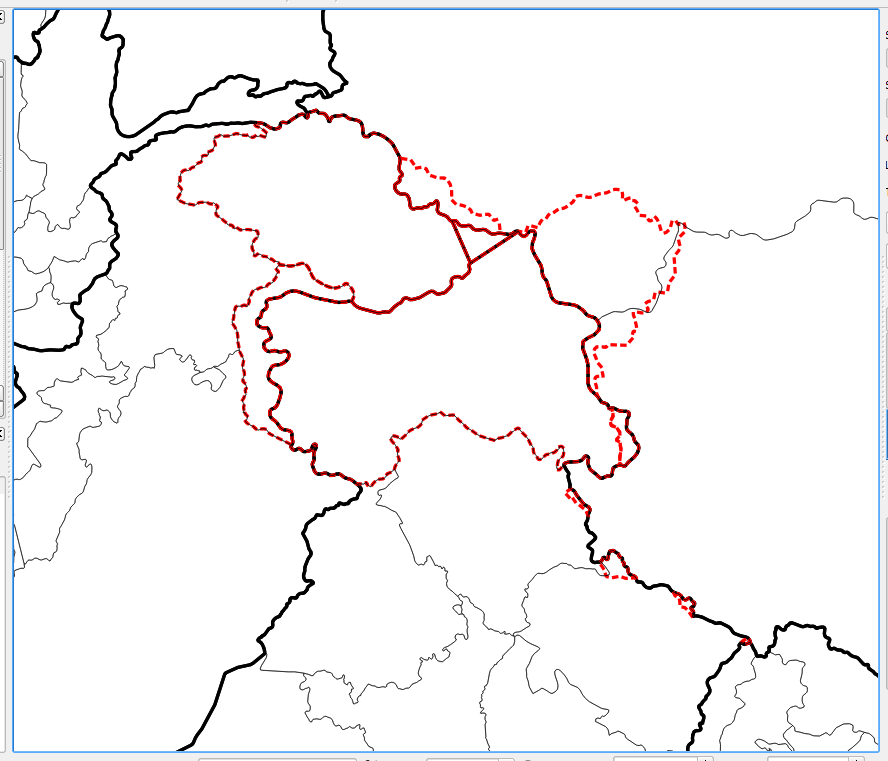
I am making a figure of the northern Himalaya, and in it are India, China, and Pakistan. These countries have disputed borders so I want to display these borders like they are displayed on Google Maps with dashed lines. But I don't know how to do this?
I have three vectors:
- Country borders (thick black)
- Regions borders (thin black)
- Disputed borders (red dashed)
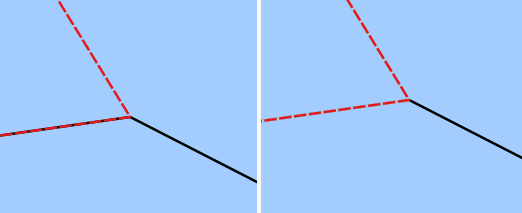
As you can see in the image below, the red dashed line has black lines appearing under it. For where there is a red line, I want only the red dashed line appearing and not the black lines. Everywhere else the black lines are fine. I believe they are polygons so that makes it a bit harder.


